
Feed aggregator
Embryos made without sperm or eggs reveal why many pregnancies fail
Embryos made without sperm or eggs reveal why many pregnancies fail
Why the Second Full Moon of May is a ‘Blue Minimoon’
There’s nothing like a random celestial coincidence, turned good internet meme. In this case, the chance event is this weekend’s Full Moon, which also happens to be the second Full Moon of May, and is also the most distant and visually smallest Full Moon of the year.
Students Build Moon Robots for NASA’s 2026 Lunabotics Challenge
Students Build Moon Robots for NASA’s 2026 Lunabotics Challenge
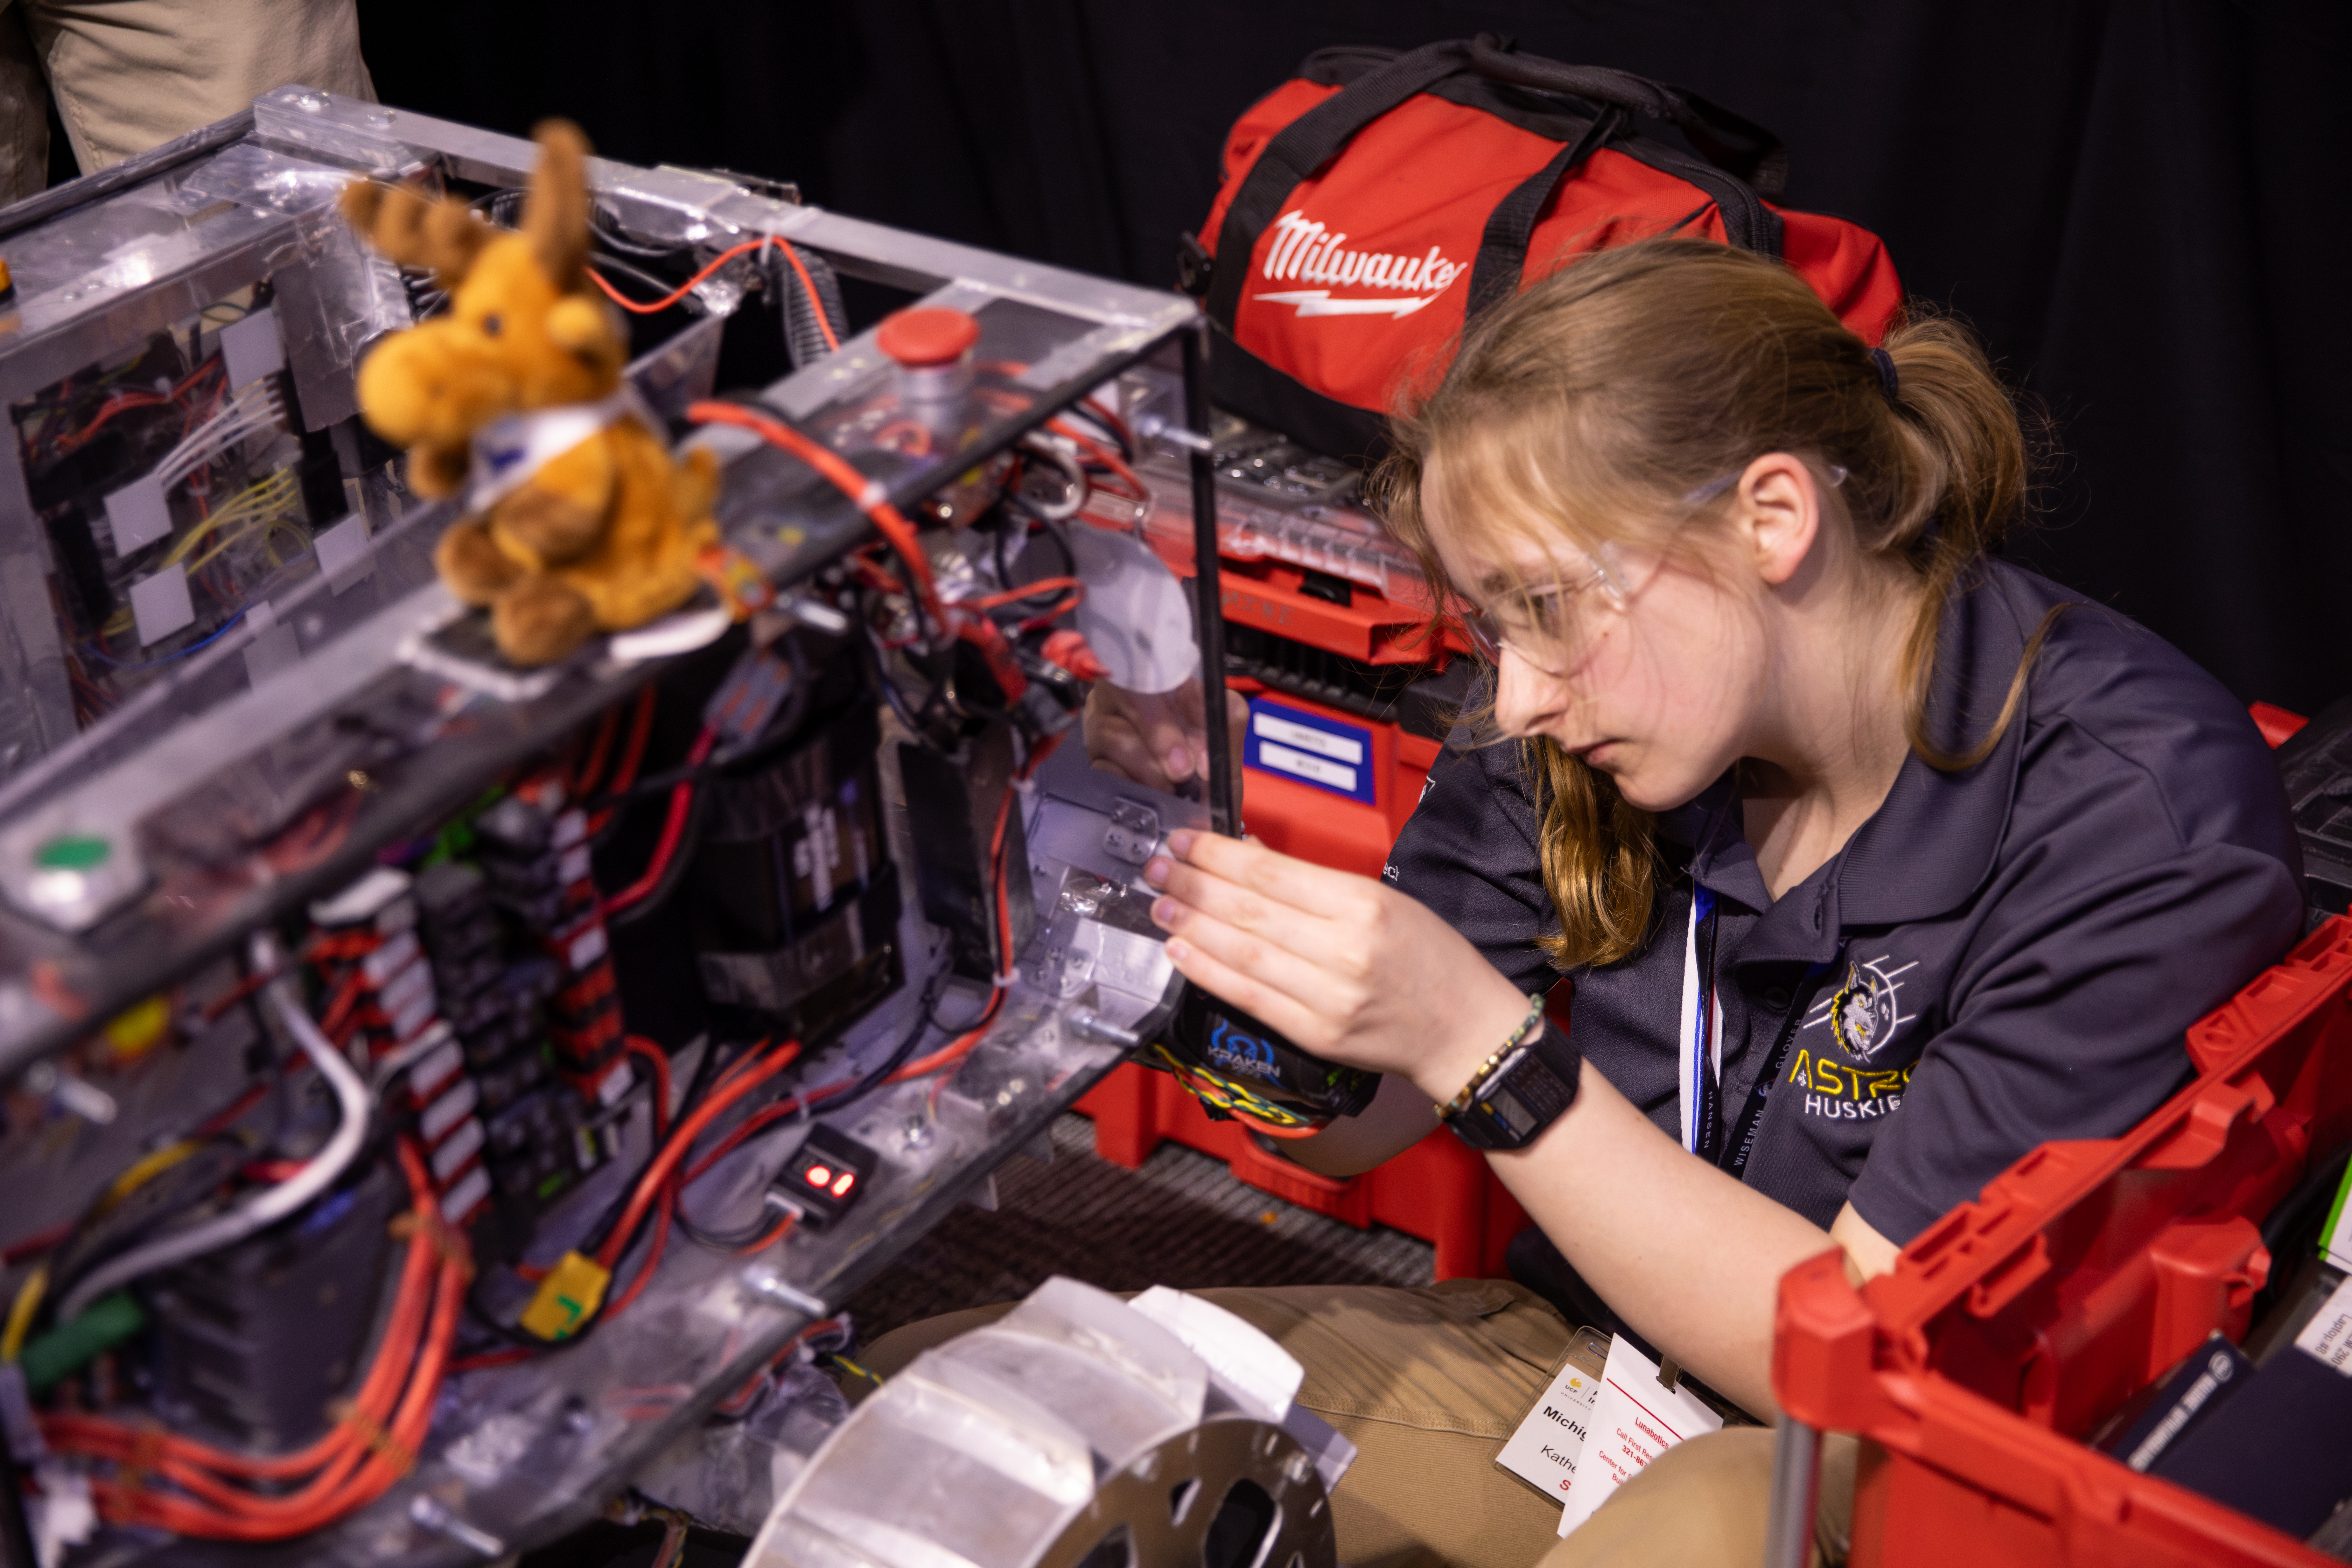
Katherine Rauscher of Michigan Technological University prepares her team’s prototype lunar robot for its turn during the finals for NASA’s 2026 Lunabotics Challenge competition on Tuesday, May 19, 2026, at the Kennedy Space Center Visitor Complex in Florida.
Forty-seven teams from around the U.S. designed and built remote-controlled robots capable of traversing challenging lunar terrain while constructing regolith-based berm under conditions similar to those the agency will face as it returns to the lunar surface through Artemis.
The Lunabotics Challenge invites students from higher education institutions to apply NASA’s Systems Engineering principles to design and build a prototype off-world construction robot. Participants will develop a robot capable of performing construction operations that support future space exploration objectives.
Image credit: NASA/Ben Smegelsky
Students Build Moon Robots for NASA’s 2026 Lunabotics Challenge
Katherine Rauscher of Michigan Technological University prepares her team’s prototype lunar robot for its turn during the finals for NASA’s 2026 Lunabotics Challenge competition on Tuesday, May 19, 2026, at the Kennedy Space Center Visitor Complex in Florida.
Forty-seven teams from around the U.S. designed and built remote-controlled robots capable of traversing challenging lunar terrain while constructing regolith-based berm under conditions similar to those the agency will face as it returns to the lunar surface through Artemis.
The Lunabotics Challenge invites students from higher education institutions to apply NASA’s Systems Engineering principles to design and build a prototype off-world construction robot. Participants will develop a robot capable of performing construction operations that support future space exploration objectives.
Image credit: NASA/Ben Smegelsky
NASA-European Sea Level Mission Homes in on El Niño
To view this video please enable JavaScript, and consider upgrading to a web browser that supports HTML5 video
The international Sentinel-6 Michael Freilich sea level satellite observed a swell of warm water, called a Kelvin wave, moving eastward in the equatorial Pacific Ocean, arriving off the South American coast in May. Warm Kelvin waves often precede El Niño events.NASA/JPL-CaltechSea level data from a satellite launched by NASA and European partners shows that a swell of warm water hundreds of miles wide has arrived in the Pacific Ocean off the coast of South America, a sign that El Niño will likely emerge later in the year. Because water expands as it warms, a rise in elevation of an area of the ocean indicates increasing ocean temperatures.
El Niños can cause heavy precipitation in some regions and deficits in others, influencing daily life and commerce around the world.
Launched in 2020 by NASA and led by ESA (European Space Agency) for the E.U. Copernicus Programme, the Sentinel-6 Michael Freilich satellite measures and maps water height for the entire ocean every 10 days, down to fractions of an inch. In the case of El Niño, the satellite tracks what are called warm Kelvin waves.
These waves typically form after brief periods when winds over the far western equatorial Pacific Ocean shift from prevailing easterlies — moving from east to west — to westerlies. That effect, combined with a general weakening of easterly winds along the equator, causes water in the tropics of the western Pacific to get warmer and sea levels to rise. The wave that forms then propagates east for several weeks, eventually reaching South America and causing water off the coast to heat up and rise. An El Niño develops as multiple Kelvin waves appear over the course of several months, and the warm water accumulates off the shores of Colombia, Ecuador, and Peru.
“While this year’s event started a bit later than the big El Niños of 2015 and 1997, it’s beginning to catch up,” said Josh Willis, a sea level researcher at NASA’s Jet Propulsion Laboratory in Southern California and project scientist for Sentinel-6 Michael Freilich. “We’ll see how big it gets.”
Measurements from Sentinel-6 Michael Freilich show a small Kelvin wave forming around Micronesia in late January and dissipating by mid-February. A new wave emerged in early March, then moved east over time. By mid-May, the seas around Peru were more than 5.9 inches (15 centimeters) higherthan long-term averages.
“NASA’s observation of El Niño uses sea level satellites like Sentinel-6 Michael Freilich to track massive Kelvin waves as they cross the Pacific, capture changes in Earth’s ocean thermodynamics, improve forecasts of weather extremes, and help communities prepare for potential coastal hazards,” said Nadya Vinogradova Shiffer, lead program scientist at NASA Headquarters in Washington. “Stay tuned as more ocean stories continue to unfold.”
Tracking El NiñoFishermen in the 1600s coined the name El Niño — Spanish for “the boy,” a reference to the birth of baby Jesus — because it tended to intensify around Christmastime. Warmer waters meant they would catch fewer fish.
Warmer sea surface temperatures in the central and eastern Pacific affect atmospheric circulation patterns worldwide by shifting the jet stream, which impacts storm tracks. This can lead to heavy rain and snow in some areas and unusual heat and dryness in others. How far away those impacts appear depends on the strength of the El Niño.
In more modest events, like the ones that began in 2018 and 2023, impacts such as drought and flooding were mostly seeb in and around the tropical Pacific. Large El Niños, like the one in 2015-2016, reach much farther, causing drought in Africa and flooding in California.
El Niños usually peak between November and January, so it will be several months before the largest impacts become clear.
“Every El Niño is different,” said JPL sea level researcher Severine Fournier, deputy project scientist for Sentinel-6 Michael Freilich. “But they almost always make for a hot year and big changes in rainfall in parts of the globe.”
Sentinel-6 Michael Freilich is the current official reference satellite for global sea level measurements. Launched in 2020, it is continuing a legacy started in 1992 by the TOPEX/Poseidon satellite. A series of successors have carried the baton since then, and the latest, Sentinel-6B, which launched November 2025, will take over for its predecessor by the end of 2026.
More about Sentinel-6 Michael FreilichSentinel-6 Michael Freilich, named after former NASA Earth Science Division Director Michael Freilich, is one of two satellites that compose the Copernicus Sentinel-6/Jason-CS (Continuity of Service) mission.
Sentinel-6/Jason-CS, a part of the European Union’s Earth observation programme called Copernicus, was jointly developed by ESA, the European Organisation for the Exploitation of Meteorological Satellites (EUMETSAT), NASA, and the National Oceanic and Atmospheric Administration (NOAA), with funding support from the European Commission and technical support on performance from the French space agency CNES (Centre National d’Études Spatiales). Spacecraft monitoring and control, as well as the processing of all the altimeter science data, is carried out by EUMETSAT on behalf of the European Union’s Copernicus Programme, with the support of all partner agencies.
A division of Caltech in Pasadena, JPL contributed three science instruments for each Sentinel-6 satellite: the Advanced Microwave Radiometer, the Global Navigation Satellite System – Radio Occultation, and the Laser Retroreflector Array. NASA also contributed launch services, ground systems supporting operation of the NASA science instruments, the science data processors for two of these instruments, and support for the U.S. members of the international Ocean Surface Topography Science Team.
To learn more about Sentinel-6 Michael Freilich, visit:
https://www.nasa.gov/sentinel-6
Media ContactsAndrew Wang / Andrew Good
Jet Propulsion Laboratory, Pasadena, Calif.
626-379-6874 / 818-393-2433
andrew.wang@jpl.nasa.gov / andrew.c.good@jpl.nasa.gov
2026-035
Explore More 5 min read NASA Develops Sensor to Improve Firefighter Safety Article 4 hours ago 2 min read Released: NASA Goddard Issues Draft Request for Proposal for the Landsat 10 SpacecraftThe Landsat 10 Spacecraft Draft Request for Proposal (DRFP) is available for review via SAM.gov.
Article 5 hours ago 1 min read Webinar 6/17: Discover, Access, and Task Commercial Data with NASA’s Satellite Data ExplorerLearn how to use the Satellite Data Explorer to search, access, and task commercial Earth…
Article 10 hours ago Keep Exploring Discover More Topics From NASA Mission: Sentinel-6 Michael FreilichWhen did Sentinel-6 Michael Freilich launch? November 21, 2020 Where is Sentinel-6 Michael Freilich? 830 miles (1,336 km) above Earth…
Water | Earth Observatory Topic
Climate ChangeNASA is a global leader in studying Earth’s changing climate.
Jet Propulsion Laboratory
NASA-European Sea Level Mission Homes in on El Niño
To view this video please enable JavaScript, and consider upgrading to a web browser that supports HTML5 video
The international Sentinel-6 Michael Freilich sea level satellite observed a swell of warm water, called a Kelvin wave, moving eastward in the equatorial Pacific Ocean, arriving off the South American coast in May. Warm Kelvin waves often precede El Niño events.NASA/JPL-CaltechSea level data from a satellite launched by NASA and European partners shows that a swell of warm water hundreds of miles wide has arrived in the Pacific Ocean off the coast of South America, a sign that El Niño will likely emerge later in the year. Because water expands as it warms, a rise in elevation of an area of the ocean indicates increasing ocean temperatures.
El Niños can cause heavy precipitation in some regions and deficits in others, influencing daily life and commerce around the world.
Launched in 2020 by NASA and led by ESA (European Space Agency) for the E.U. Copernicus Programme, the Sentinel-6 Michael Freilich satellite measures and maps water height for the entire ocean every 10 days, down to fractions of an inch. In the case of El Niño, the satellite tracks what are called warm Kelvin waves.
These waves typically form after brief periods when winds over the far western equatorial Pacific Ocean shift from prevailing easterlies — moving from east to west — to westerlies. That effect, combined with a general weakening of easterly winds along the equator, causes water in the tropics of the western Pacific to get warmer and sea levels to rise. The wave that forms then propagates east for several weeks, eventually reaching South America and causing water off the coast to heat up and rise. An El Niño develops as multiple Kelvin waves appear over the course of several months, and the warm water accumulates off the shores of Colombia, Ecuador, and Peru.
“While this year’s event started a bit later than the big El Niños of 2015 and 1997, it’s beginning to catch up,” said Josh Willis, a sea level researcher at NASA’s Jet Propulsion Laboratory in Southern California and project scientist for Sentinel-6 Michael Freilich. “We’ll see how big it gets.”
Measurements from Sentinel-6 Michael Freilich show a small Kelvin wave forming around Micronesia in late January and dissipating by mid-February. A new wave emerged in early March, then moved east over time. By mid-May, the seas around Peru were more than 5.9 inches (15 centimeters) higherthan long-term averages.
“NASA’s observation of El Niño uses sea level satellites like Sentinel-6 Michael Freilich to track massive Kelvin waves as they cross the Pacific, capture changes in Earth’s ocean thermodynamics, improve forecasts of weather extremes, and help communities prepare for potential coastal hazards,” said Nadya Vinogradova Shiffer, lead program scientist at NASA Headquarters in Washington. “Stay tuned as more ocean stories continue to unfold.”
Tracking El NiñoFishermen in the 1600s coined the name El Niño — Spanish for “the boy,” a reference to the birth of baby Jesus — because it tended to intensify around Christmastime. Warmer waters meant they would catch fewer fish.
Warmer sea surface temperatures in the central and eastern Pacific affect atmospheric circulation patterns worldwide by shifting the jet stream, which impacts storm tracks. This can lead to heavy rain and snow in some areas and unusual heat and dryness in others. How far away those impacts appear depends on the strength of the El Niño.
In more modest events, like the ones that began in 2018 and 2023, impacts such as drought and flooding were mostly seeb in and around the tropical Pacific. Large El Niños, like the one in 2015-2016, reach much farther, causing drought in Africa and flooding in California.
El Niños usually peak between November and January, so it will be several months before the largest impacts become clear.
“Every El Niño is different,” said JPL sea level researcher Severine Fournier, deputy project scientist for Sentinel-6 Michael Freilich. “But they almost always make for a hot year and big changes in rainfall in parts of the globe.”
Sentinel-6 Michael Freilich is the current official reference satellite for global sea level measurements. Launched in 2020, it is continuing a legacy started in 1992 by the TOPEX/Poseidon satellite. A series of successors have carried the baton since then, and the latest, Sentinel-6B, which launched November 2025, will take over for its predecessor by the end of 2026.
More about Sentinel-6 Michael FreilichSentinel-6 Michael Freilich, named after former NASA Earth Science Division Director Michael Freilich, is one of two satellites that compose the Copernicus Sentinel-6/Jason-CS (Continuity of Service) mission.
Sentinel-6/Jason-CS, a part of the European Union’s Earth observation programme called Copernicus, was jointly developed by ESA, the European Organisation for the Exploitation of Meteorological Satellites (EUMETSAT), NASA, and the National Oceanic and Atmospheric Administration (NOAA), with funding support from the European Commission and technical support on performance from the French space agency CNES (Centre National d’Études Spatiales). Spacecraft monitoring and control, as well as the processing of all the altimeter science data, is carried out by EUMETSAT on behalf of the European Union’s Copernicus Programme, with the support of all partner agencies.
A division of Caltech in Pasadena, JPL contributed three science instruments for each Sentinel-6 satellite: the Advanced Microwave Radiometer, the Global Navigation Satellite System – Radio Occultation, and the Laser Retroreflector Array. NASA also contributed launch services, ground systems supporting operation of the NASA science instruments, the science data processors for two of these instruments, and support for the U.S. members of the international Ocean Surface Topography Science Team.
To learn more about Sentinel-6 Michael Freilich, visit:
https://www.nasa.gov/sentinel-6
Media ContactsAndrew Wang / Andrew Good
Jet Propulsion Laboratory, Pasadena, Calif.
626-379-6874 / 818-393-2433
andrew.wang@jpl.nasa.gov / andrew.c.good@jpl.nasa.gov
2026-035
Explore More 5 min read A Shift in What’s Shaping U.S. LandscapesWild disturbances are on the rise, while land disturbed by human activity has been decreasing.
Article 19 minutes ago 5 min read NASA Develops Sensor to Improve Firefighter Safety Article 7 hours ago 2 min read Released: NASA Goddard Issues Draft Request for Proposal for the Landsat 10 SpacecraftThe Landsat 10 Spacecraft Draft Request for Proposal (DRFP) is available for review via SAM.gov.
Article 8 hours ago Keep Exploring Discover More Topics From NASA Mission: Sentinel-6 Michael FreilichWhen did Sentinel-6 Michael Freilich launch? November 21, 2020 Where is Sentinel-6 Michael Freilich? 830 miles (1,336 km) above Earth…
Water | Earth Observatory Topic
Climate ChangeNASA is a global leader in studying Earth’s changing climate.
Jet Propulsion Laboratory
Lost in the Star Clouds — A Milky Way Odyssey
I share my "discovery" of a new Milky Way star cloud that's been staring at me for ages.
The post Lost in the Star Clouds — A Milky Way Odyssey appeared first on Sky & Telescope.
Webinar 6/17: Discover, Access, and Task Commercial Data with NASA’s Satellite Data Explorer
- CSDA
- Commercial Data
- CSDA Vendors
- Program Activities
- Learning Resources
- FAQs
- News
1 min read
Webinar 6/17: Discover, Access, and Task Commercial Data with NASA’s Satellite Data Explorer This screen capture shows a multispectral image from Vantor in the CSDA program’s Satellite Data Explorer user interface. Credit: (C) Vantor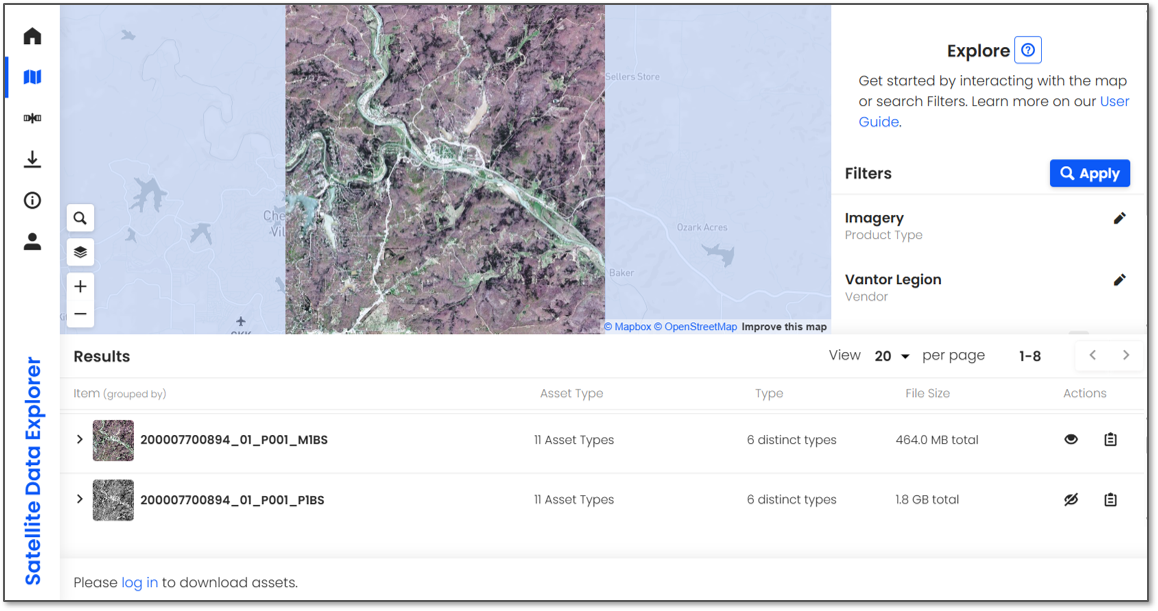
Join us for an NASA Commercial Satellite Data Acquisition (CSDA) program webinar on Wednesday, June 17, 2026, at 2:00 p.m. EDT (-04:00 UTC) to learn how to use the Satellite Data Explorer(SDX) to search, access, and task commercial Earth Observation data available through NASA’s CSDA program.
The SDX is a web-based data discovery, access, and data tasking platform developed under the CSDA program that enables approved users to discover, access, task, and download commercial Earth observation data available through the program.
During this webinar event, data users will learn how to use the SDX to streamline their data workflow. A live demonstration will focus on the key features and functionalities of the tool from searching and filtering capabilities (e.g., by area-of-interest, product type, vendor) to visualizing query results through interactive maps and quick-look browse imagery. Webinar participants will also learn how to use the new Data Acquisition Request System to submit and track commercial data tasking requests for future acquisitions.
Register for WebinarWebinar 6/17: Discover, Access, and Task Commercial Data with NASA’s Satellite Data Explorer
- CSDA
- Commercial Data
- CSDA Vendors
- Program Activities
- Learning Resources
- FAQs
- News
1 min read
Webinar 6/17: Discover, Access, and Task Commercial Data with NASA’s Satellite Data Explorer This screen capture shows a multispectral image from Vantor in the CSDA program’s Satellite Data Explorer user interface. Credit: (C) VantorJoin us for an NASA Commercial Satellite Data Acquisition (CSDA) program webinar on Wednesday, June 17, 2026, at 2:00 p.m. EDT (-04:00 UTC) to learn how to use the Satellite Data Explorer(SDX) to search, access, and task commercial Earth Observation data available through NASA’s CSDA program.
The SDX is a web-based data discovery, access, and data tasking platform developed under the CSDA program that enables approved users to discover, access, task, and download commercial Earth observation data available through the program.
During this webinar event, data users will learn how to use the SDX to streamline their data workflow. A live demonstration will focus on the key features and functionalities of the tool from searching and filtering capabilities (e.g., by area-of-interest, product type, vendor) to visualizing query results through interactive maps and quick-look browse imagery. Webinar participants will also learn how to use the new Data Acquisition Request System to submit and track commercial data tasking requests for future acquisitions.
Register for WebinarGigantic ‘little red dot’ threatens to upend cosmic history
Debate still swirls around the nature of “little red dots,” black holes glimpsed in the early universe by the James Webb Space Telescope. A controversial new weigh-in may settle the matter
Webb reveals black hole that formed before its galaxy
Using the unprecedented imaging and spectroscopic power of the NASA/ESA/CSA James Webb Space Telescope, researchers have mapped the motion and composition of gas orbiting a black hole in the centre of Abell2744-QSO1, a tiny galaxy more than 13 billion light-years away. The results suggest that the 50-million-solar-mass black hole predates its host galaxy, possibly forming within the first second of the Big Bang, and must have been immense from the start.
NASA’s Webb Reveals Black Hole That Formed Before Its Galaxy
- Webb
- News
- Overview
- Science
- Observatory
- Multimedia
- Team
- More
Image: NASA, ESA, CSA, Lukas Furtak (Ben-Gurion University); Image Processing: Alyssa Pagan (STScI)
Which comes first, the galaxy or the black hole? We don’t know, but scientists have long thought it could be the galaxy: Large stars within an existing galaxy consume their fuel and collapse to form black holes, which can gobble up surrounding material and merge over time to form more massive entities.
But it’s hard to figure out how black holes millions to billions of times the mass of the Sun, thousands of which have now been detected in the early universe, could have grown so quickly from such small seeds.
Now, researchers using NASA’s James Webb Space Telescope have detected clear evidence that some supermassive black holes were enormous from the beginning, forming without a stellar collapse phase, and without a significantly more massive host galaxy to feed them.
“This is a remarkable finding,” said Roberto Maiolino of University of Cambridge in the United Kingdom, co-author of studies published in Nature and the Monthly Notices of the Royal Astronomical Society. “It’s a paradigm shift, a total revisiting of the classical scenarios of how black holes form and grow.”
Little Red Dot QSO1The team’s conclusion is based on detailed observations of Abell2744-QSO1 (QSO1), a prototypical Little Red Dot that existed just 700 million years after the big bang.
Although QSO1 is only 1,300 light-years across, and its light has been traveling for more than 13 billion years, it is easier to study than most other Little Red Dots because it is gravitationally lensed by galaxy cluster Abell 2744 (Pandora’s Cluster). QSO1 is both magnified and triply imaged, appearing in three different locations in the sky.
Initial studies of QSO1 revealed compelling evidence that it may be little more than a cloud of glowing hydrogen and helium gas circling a supermassive black hole estimated at 40 million times the mass of the Sun. But as with other early black holes discovered by Webb, there was uncertainty about whether it really was that massive.
“Before now, all of the mass measurements of black holes in the early universe have been indirect, based on assumptions from what we know about them in the local universe. We didn’t know if those assumptions really apply to the distant universe,” said co-author Francesco D’Eugenio, also of the University of Cambridge.
Image: Little Red Dot Abell2744-QSO1 (NIRCam Image) An image from NIRCam on NASA’s James Webb Space Telescope shows Little Red Dot Abell2744-QSO1, magnified and triply imaged by galaxy cluster Abell 2744 (Pandora’s Cluster). Image: NASA, ESA, CSA, Lukas Furtak (Ben-Gurion University); Image Processing: Alyssa Pagan (STScI) Mapping gas composition, velocity
The team recognized that if QSO1’s black hole is as massive as it looks, they should be able to use the integral field unit (IFU) on Webb’s NIRSpec (Near Infrared Spectrograph) to trace the effects of its gravity on the gas swirling around it, while also mapping the distribution of various elements in the gas.
Cambridge graduate student Ignas Juodžbalis and Cosimo Marconcini of the University of Florence, lead authors on one of the studies, used the IFU observations to map motions of hydrogen gas surrounding the black hole. When they plotted the rotation velocity as a function of distance from the center, they found that the gas has Keplerian motion: It orbits a central point in the same way that planets in our solar system orbit the Sun.
“This is important because it tells us that most of the mass of QSO1 is concentrated in the black hole at the center,” said Juodžbalis. “If the mass were more distributed, as it would be if there were a lot of stars, the gas would not have this perfect Keplerian rotation.”
Since Keplerian motion is governed by simple laws of gravity, the team was able to use the gas velocity measurements to calculate the black hole mass directly, a feat that had not previously been possible.
They found that not only is the black hole immense — roughly 50 million solar masses — it makes up, at minimum, an astonishing two-thirds of QSO1’s total mass. This proportion is thousands of times greater than in nearby galaxies, where supermassive black holes make up only a tiny fraction of the host galaxy’s total mass.
The IFU composition maps supported these results, showing that the gas throughout QSO1 is almost entirely hydrogen and helium, with very little of the heavier elements like oxygen that would be expected in a galaxy rich with stars and stellar debris. With a metallicity less than 0.5% of the Sun, QSO1 is one of the most pristine galactic environments ever measured.
“This is a phenomenal result,” said Maiolino. “It is the first direct measurement of a black hole mass within the first billion years after the big bang, and it is consistent with the previous measurements.” The team thinks this is a good sign that the assumptions used for indirect mass measurements are valid and the masses of other black holes in the early universe have not been overestimated.
Supermassive black hole originsThe outsized mass of QSO1 relative to its host galaxy suggests that it can’t have formed gradually from much smaller, stellar-mass black holes merging and feeding. “It seems that we have found a black hole that does not have a substantial host galaxy and that has predated stellar processes,” said Juodžbalis. “This is very exciting because it is evidence for primordial black holes or direct collapse black holes, which have been theorized but not confirmed.”
Whether QSO1’s black hole evolved from a “heavy seed” that formed within the first second of the big bang or somewhat later from the collapse of a giant cloud of gas, it was almost certainly born big, and may be in the early stages of building a galaxy around it.
The team thinks that Little Red Dots like QSO1 cannot have been rare in the early universe, and is in the process of analyzing similar objects to find out whether supermassive black holes actually do predate the galaxies where they currently reside.
The James Webb Space Telescope is the world’s premier space science observatory. Webb is solving mysteries in our solar system, looking beyond to distant worlds around other stars, and probing the mysterious structures and origins of our universe and our place in it. Webb is an international program led by NASA with its partners, ESA (European Space Agency) and CSA (Canadian Space Agency).
To learn more about Webb, visit:
Downloads & Related InformationThe following sections contain links to download this article’s images and videos in all available resolutions followed by related information links, media contacts, and if available, research paper and Spanish translation links.
Related Images & Videos Little Red Dot Abell2744-QSO1 (NIRCam Image)
An image from NIRCam on NASA’s James Webb Space Telescope shows Little Red Dot Abell2744-QSO1, magnified and triply imaged by galaxy cluster Abell 2744 (Pandora’s Cluster).
Little Red Dot Abell2744-QSO1a (NIRCam Image with NIRSpec IFU Velocity Map)
An image detail from NIRCam (left) on NASA’s James Webb Space Telescope shows Little Red Dot Abell2744-QSO1. A map of gas velocity in QSO1 (right), made using the IFU on NIRSpec, shows evidence for a 50-million-solar-mass black hole at the center.
Little Red Dot Abell2744-QSO1 (NIRCam Compass Image)
Image of Abell 2744 and Little Red Dot Abell2744-QSO1, captured by Webb’s NIRCam, with compass arrows, scale bar, and color key for reference.
Little Red Dot Abell2744-QSO1: Sonification of Gas Velocity Around a Supermassive Black Hole (NIRCam and NIRSpec IFU)
A sonification is a translation of data into sound. In this sonification, the velocity of hydrogen gas moving around a black hole in the center of a Little Red Dot known as Abell2744-QSO1 (QSO1) is translated into sounds of varying pitch (or frequency). The faster the gas is movi…
Related Links
Watch: NASA Black Hole Visualization Takes Viewers Beyond the Brink
Explore more: ViewSpace | Black Holes: Searching for the unseen
Read more: Dissecting Supermassive Black Holes
Watch: What Webb Learns from Light
Explore more: NASA’s Universe of Learning: Black Hole Resources
Contact Media
Laura Betz
NASA’s Goddard Space Flight Center
Greenbelt, Maryland
laura.e.betz@nasa.gov
Margaret Carruthers
Space Telescope Science Institute
Baltimore, Maryland
Hannah Braun
Space Telescope Science Institute
Baltimore, Maryland
Related Terms Keep Exploring Related Topics James Webb Space Telescope
Webb is the premier observatory of the next decade, serving thousands of astronomers worldwide. It studies every phase in the…
Galaxies
Black Holes
Universe
NASA’s Webb Reveals Black Hole That Formed Before Its Galaxy
- Webb
- News
- Overview
- Science
- Observatory
- Multimedia
- Team
- More
Image: NASA, ESA, CSA, Lukas Furtak (Ben-Gurion University); Image Processing: Alyssa Pagan (STScI)
Which comes first, the galaxy or the black hole? We don’t know, but scientists have long thought it could be the galaxy: Large stars within an existing galaxy consume their fuel and collapse to form black holes, which can gobble up surrounding material and merge over time to form more massive entities.
But it’s hard to figure out how black holes millions to billions of times the mass of the Sun, thousands of which have now been detected in the early universe, could have grown so quickly from such small seeds.
Now, researchers using NASA’s James Webb Space Telescope have detected clear evidence that some supermassive black holes were enormous from the beginning, forming without a stellar collapse phase, and without a significantly more massive host galaxy to feed them.
“This is a remarkable finding,” said Roberto Maiolino of University of Cambridge in the United Kingdom, co-author of studies published in Nature and the Monthly Notices of the Royal Astronomical Society. “It’s a paradigm shift, a total revisiting of the classical scenarios of how black holes form and grow.”
Little Red Dot QSO1The team’s conclusion is based on detailed observations of Abell2744-QSO1 (QSO1), a prototypical Little Red Dot that existed just 700 million years after the big bang.
Although QSO1 is only 1,300 light-years across, and its light has been traveling for more than 13 billion years, it is easier to study than most other Little Red Dots because it is gravitationally lensed by galaxy cluster Abell 2744 (Pandora’s Cluster). QSO1 is both magnified and triply imaged, appearing in three different locations in the sky.
Initial studies of QSO1 revealed compelling evidence that it may be little more than a cloud of glowing hydrogen and helium gas circling a supermassive black hole estimated at 40 million times the mass of the Sun. But as with other early black holes discovered by Webb, there was uncertainty about whether it really was that massive.
“Before now, all of the mass measurements of black holes in the early universe have been indirect, based on assumptions from what we know about them in the local universe. We didn’t know if those assumptions really apply to the distant universe,” said co-author Francesco D’Eugenio, also of the University of Cambridge.
Image: Little Red Dot Abell2744-QSO1 (NIRCam Image) An image from NIRCam on NASA’s James Webb Space Telescope shows Little Red Dot Abell2744-QSO1, magnified and triply imaged by galaxy cluster Abell 2744 (Pandora’s Cluster). Image: NASA, ESA, CSA, Lukas Furtak (Ben-Gurion University); Image Processing: Alyssa Pagan (STScI) Mapping gas composition, velocityThe team recognized that if QSO1’s black hole is as massive as it looks, they should be able to use the integral field unit (IFU) on Webb’s NIRSpec (Near Infrared Spectrograph) to trace the effects of its gravity on the gas swirling around it, while also mapping the distribution of various elements in the gas.
Cambridge graduate student Ignas Juodžbalis and Cosimo Marconcini of the University of Florence, lead authors on one of the studies, used the IFU observations to map motions of hydrogen gas surrounding the black hole. When they plotted the rotation velocity as a function of distance from the center, they found that the gas has Keplerian motion: It orbits a central point in the same way that planets in our solar system orbit the Sun.
“This is important because it tells us that most of the mass of QSO1 is concentrated in the black hole at the center,” said Juodžbalis. “If the mass were more distributed, as it would be if there were a lot of stars, the gas would not have this perfect Keplerian rotation.”
Since Keplerian motion is governed by simple laws of gravity, the team was able to use the gas velocity measurements to calculate the black hole mass directly, a feat that had not previously been possible.
They found that not only is the black hole immense — roughly 50 million solar masses — it makes up, at minimum, an astonishing two-thirds of QSO1’s total mass. This proportion is thousands of times greater than in nearby galaxies, where supermassive black holes make up only a tiny fraction of the host galaxy’s total mass.
The IFU composition maps supported these results, showing that the gas throughout QSO1 is almost entirely hydrogen and helium, with very little of the heavier elements like oxygen that would be expected in a galaxy rich with stars and stellar debris. With a metallicity less than 0.5% of the Sun, QSO1 is one of the most pristine galactic environments ever measured.
“This is a phenomenal result,” said Maiolino. “It is the first direct measurement of a black hole mass within the first billion years after the big bang, and it is consistent with the previous measurements.” The team thinks this is a good sign that the assumptions used for indirect mass measurements are valid and the masses of other black holes in the early universe have not been overestimated.
Supermassive black hole originsThe outsized mass of QSO1 relative to its host galaxy suggests that it can’t have formed gradually from much smaller, stellar-mass black holes merging and feeding. “It seems that we have found a black hole that does not have a substantial host galaxy and that has predated stellar processes,” said Juodžbalis. “This is very exciting because it is evidence for primordial black holes or direct collapse black holes, which have been theorized but not confirmed.”
Whether QSO1’s black hole evolved from a “heavy seed” that formed within the first second of the big bang or somewhat later from the collapse of a giant cloud of gas, it was almost certainly born big, and may be in the early stages of building a galaxy around it.
The team thinks that Little Red Dots like QSO1 cannot have been rare in the early universe, and is in the process of analyzing similar objects to find out whether supermassive black holes actually do predate the galaxies where they currently reside.
The James Webb Space Telescope is the world’s premier space science observatory. Webb is solving mysteries in our solar system, looking beyond to distant worlds around other stars, and probing the mysterious structures and origins of our universe and our place in it. Webb is an international program led by NASA with its partners, ESA (European Space Agency) and CSA (Canadian Space Agency).
To learn more about Webb, visit:
Downloads & Related InformationThe following sections contain links to download this article’s images and videos in all available resolutions followed by related information links, media contacts, and if available, research paper and Spanish translation links.
Related Images & Videos Little Red Dot Abell2744-QSO1 (NIRCam Image)
An image from NIRCam on NASA’s James Webb Space Telescope shows Little Red Dot Abell2744-QSO1, magnified and triply imaged by galaxy cluster Abell 2744 (Pandora’s Cluster).
Little Red Dot Abell2744-QSO1a (NIRCam Image with NIRSpec IFU Velocity Map)
An image detail from NIRCam (left) on NASA’s James Webb Space Telescope shows Little Red Dot Abell2744-QSO1. A map of gas velocity in QSO1 (right), made using the IFU on NIRSpec, shows evidence for a 50-million-solar-mass black hole at the center.
Little Red Dot Abell2744-QSO1 (NIRCam Compass Image)
Image of Abell 2744 and Little Red Dot Abell2744-QSO1, captured by Webb’s NIRCam, with compass arrows, scale bar, and color key for reference.
Little Red Dot Abell2744-QSO1: Sonification of Gas Velocity Around a Supermassive Black Hole (NIRCam and NIRSpec IFU)
A sonification is a translation of data into sound. In this sonification, the velocity of hydrogen gas moving around a black hole in the center of a Little Red Dot known as Abell2744-QSO1 (QSO1) is translated into sounds of varying pitch (or frequency). The faster the gas is movi…
Related Links
Watch: NASA Black Hole Visualization Takes Viewers Beyond the Brink
Explore more: ViewSpace | Black Holes: Searching for the unseen
Read more: Dissecting Supermassive Black Holes
Watch: What Webb Learns from Light
Explore more: NASA’s Universe of Learning: Black Hole Resources
Contact Media
Laura Betz
NASA’s Goddard Space Flight Center
Greenbelt, Maryland
laura.e.betz@nasa.gov
Margaret Carruthers
Space Telescope Science Institute
Baltimore, Maryland
Hannah Braun
Space Telescope Science Institute
Baltimore, Maryland
Related Terms Keep Exploring Related Topics James Webb Space Telescope
Webb is the premier observatory of the next decade, serving thousands of astronomers worldwide. It studies every phase in the…
Galaxies
Black Holes
Universe
National Institutes of Health Nutrition Education Challenge
NASA’s Center of Excellence for Collaborative Innovation (CoECI) assists in the use of crowdsourcing across the federal government. CoECI’s NASA Tournament Lab offers the contract capability to run external crowdsourced challenges on behalf of NASA and other agencies.
The National Institutes of Health (NIH) Office of Nutrition Research (ONR) invites U.S.-based, accredited, non-profit academic institutions to participate in the “Integration of Nutrition Training into Health Care Education” Challenge.
ONR’s mission is to stimulate innovative research to address the complexities of nutrition, its ecology, and its critical role in health across the lifespan for all. The goal of this challenge is to identify, evaluate, and promote effective, scalable, and evidence-based approaches to integrating nutrition training into medical and nursing education, including both established programs and emerging models with strong potential for dissemination.
The NIH Nutrition Education Challenge offers a total prize purse of up to $2,100,000 to recognize and reward exemplary nutrition curricula across three program types and two challenge tracks. Awards of up to $75,000 each will be distributed to winning institutions across the Exemplar Track and Developing Track in three program categories: Medical Schools, Residency Programs, and Nursing Programs.
Award: $2,100,000 in total prizes
Open date: May 26, 2026
Submission deadline: September 15, 2026
For more information, visit: https://nutritioneducationchallenge.org/