
Feed aggregator
The View from Above: The Gemini Visual Acuity Experiments
NASA astronaut L. Gordon Cooper, Jr. took 29 color photographs of the Earth with a 70mm camera as he orbited our planet during the Mercury-Atlas 9 mission in May 1963. Cooper’s view from the window of his Faith 7 spacecraft was spectacular, and he reported that he could see vehicles motoring on dirt roads, smoke-belching trains, and the tops of houses.
Researchers and members of the public had their doubts. Could Cooper actually see objects on the Earth’s surface in such fine detail while orbiting 100 miles above the planet? Some vision experts assumed that astronauts with 20/20 vision could not clearly see objects with sides less than 150 feet long at orbital altitudes. Although Cooper reportedly had exceptional 20/12 vision, certainly he could not see a white automobile kicking up a dust cloud near the U.S.-Mexico border as he claimed. Cooper, however, was not alone in his assertions. Other Mercury astronauts also reported seeing objects on the Earth in striking detail.
During his 22-orbit Mercury-Atlas 9 spaceflight in May 1963, L. Gordon Cooper Jr. took photos from the Faith 7 spacecraft including this one showing lakes in Western Tibet.NASA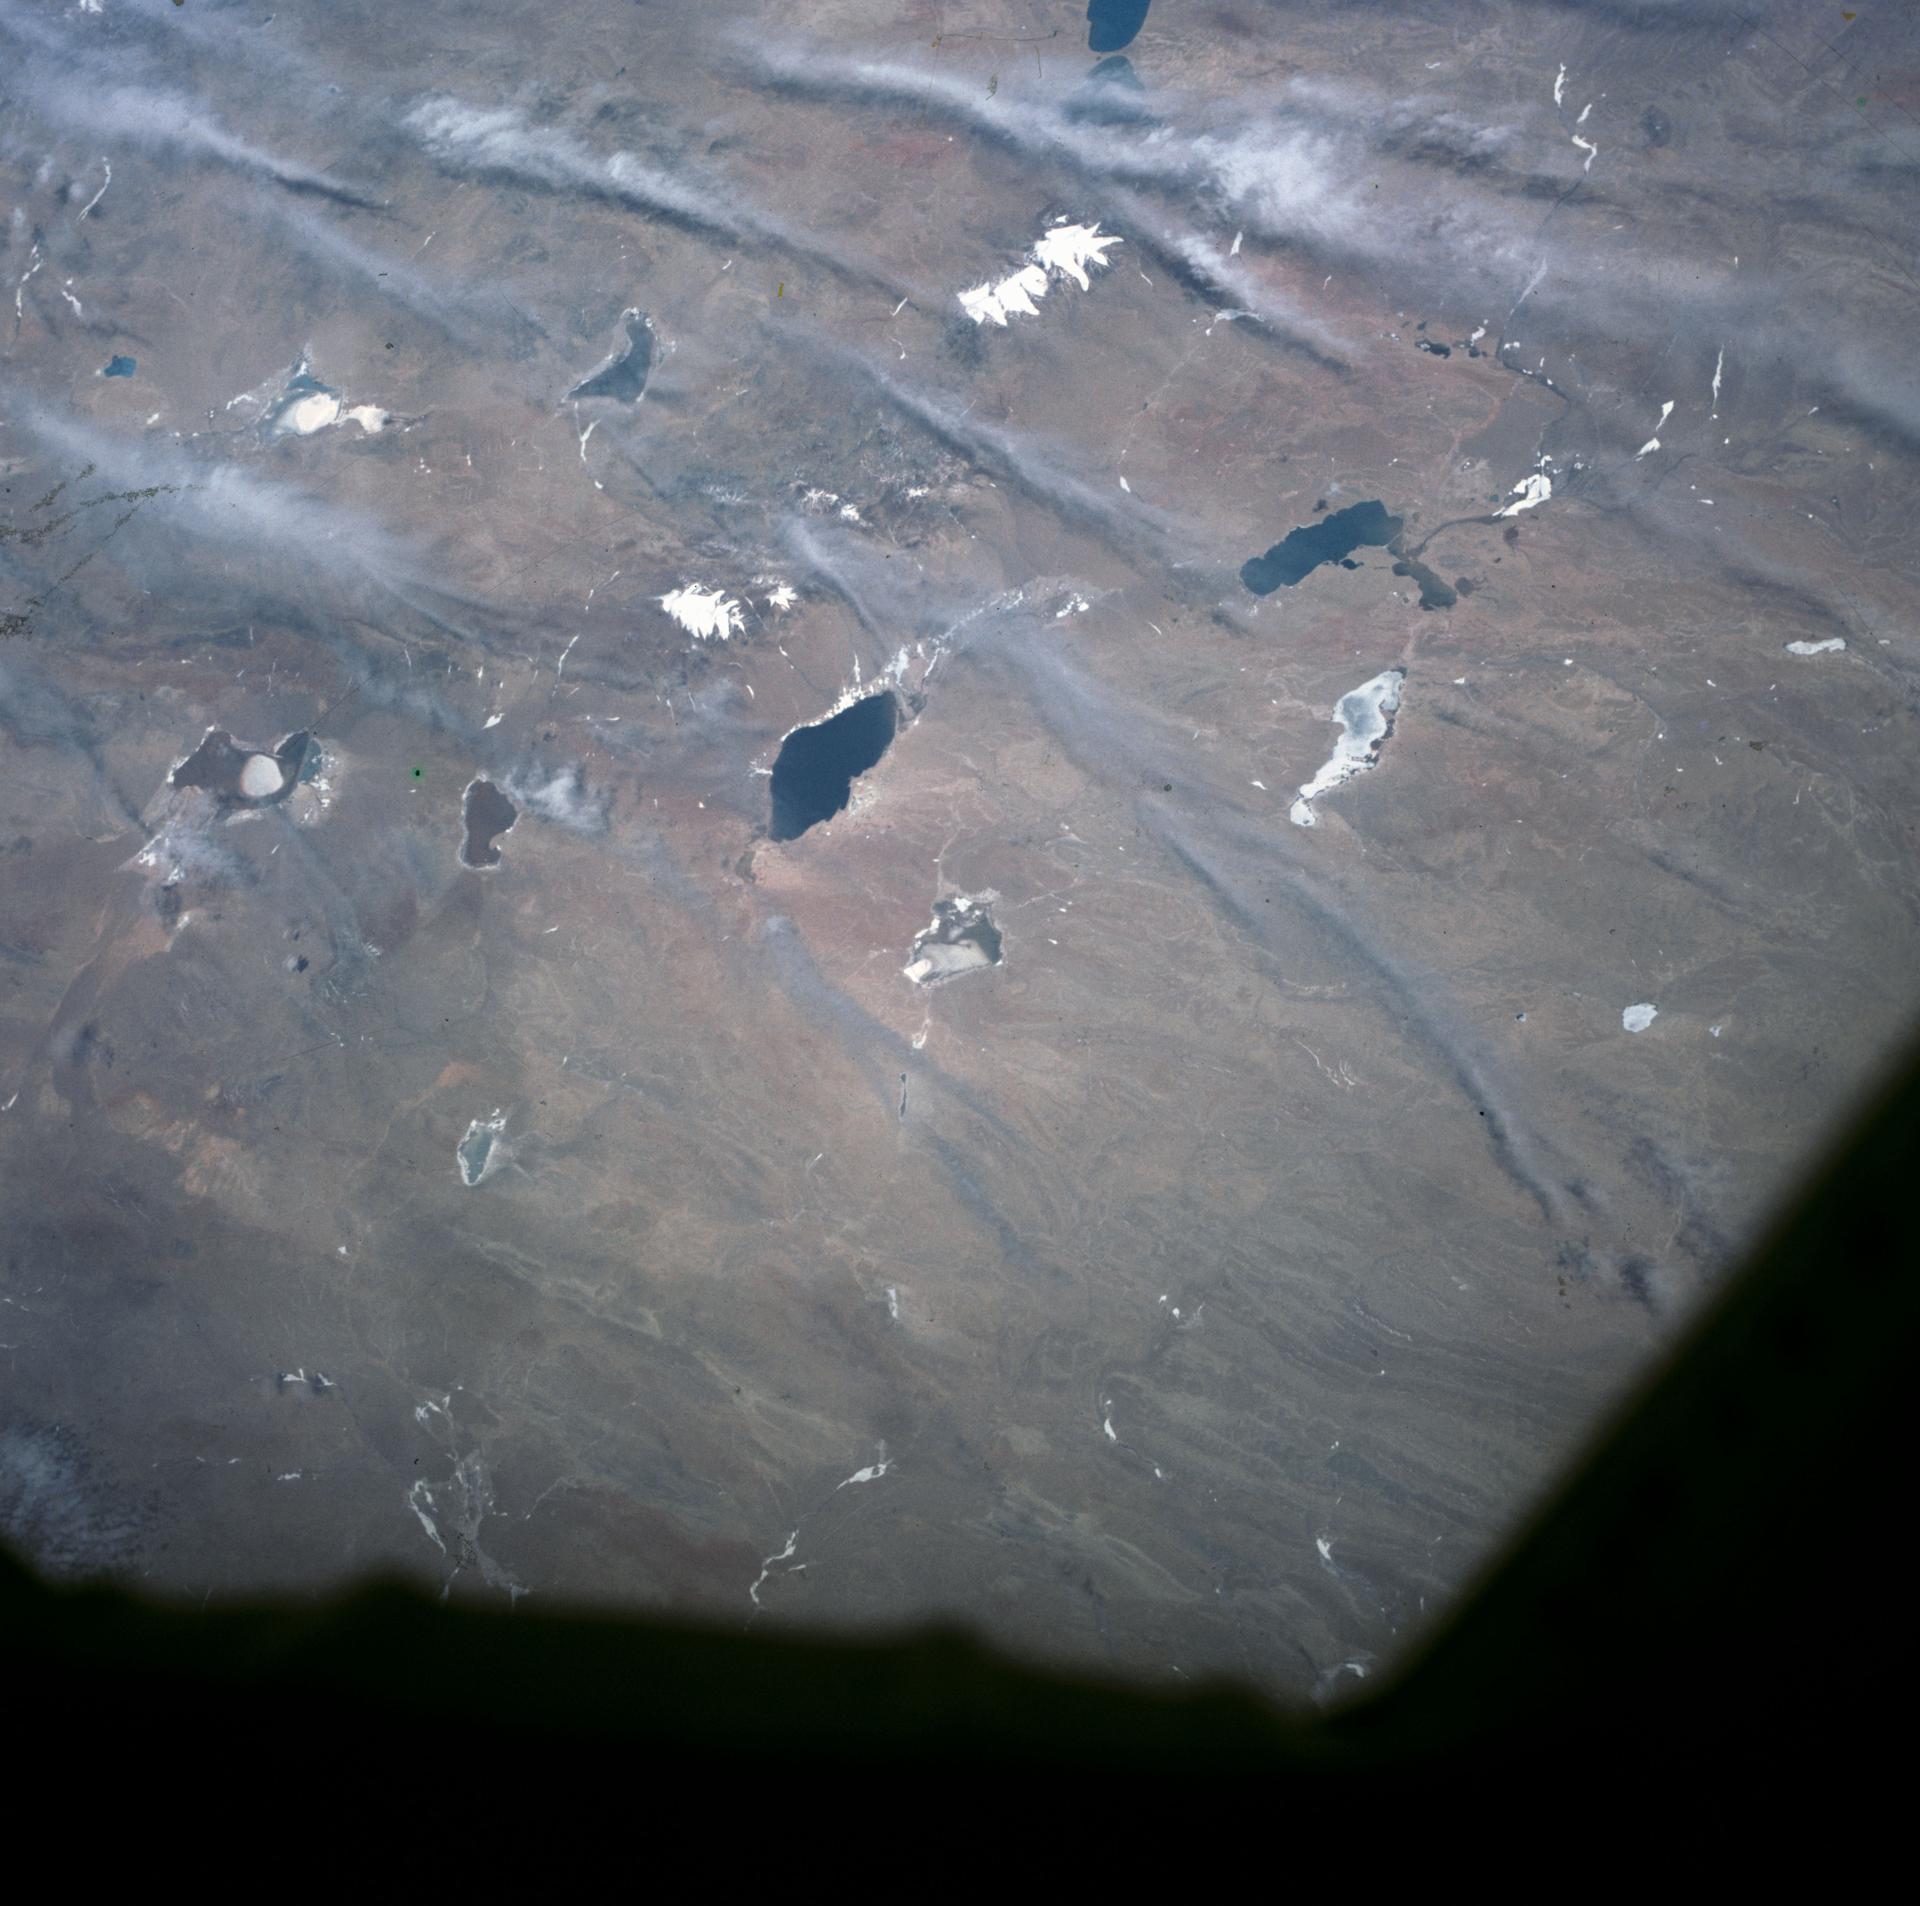
These claims caused mental health professionals to question the sanity of NASA’s first astronauts. A story in Air Force and Space Digest noted that some psychiatrists speculated that “weightlessness was causing the astronauts to hallucinate and that the space program was in for serious trouble.” While mental health experts considered the effects of space flight on the brain, visual acuity experts mulled over the Mercury astronauts’ assertions and developed an experiment to determine what they could see on Earth from space.
Putting Astronaut Vision to the TestNASA and its partners developed two visual acuity experiments and conducted them during the crewed Gemini V and Gemini VII missions. The first experiment involved looking through an optical device reminiscent of binoculars. Test subjects looked through the eyepieces to see an assortment of rectangles in various positions and levels of contrast. They were then asked to identify the directional orientation of the rectangles.
Another part of the experiment involved creating two enormous terrestrial eye charts composed of gigantic white rectangles. The rectangles, created by the Dow Chemical Corporation, ranged in size from roughly 150 to 600 feet long. The experiment team placed one set of rectangles on dark tilled soil in Laredo, Texas and another near Carnarvon, Australia, and asked Gemini V and VII astronauts to identify their directional orientation from orbit. This visual acuity tool was nicknamed the “Eye-Q” chart.
In-Flight Vision Testing InstrumentDrawing illustrating a Gemini astronaut using the In-Flight Vision Tester.NASA Gemini V Visual Acuity ExperimentThis illustration shows the intended orientation of the Gemini spacecraft as it orbited over the “Eye-Q” ground observation sites.NASACloudy conditions, sunlight scattered by the window of the Gemini spacecraft, and unfavorable orbital orientations during overflight all impacted the astronauts’ views of the ground-based experiments. Nevertheless, during some orbital revolutions, astronauts on both missions were able to see portions of the ground site near Laredo.
Aerial view of the visual acuity experiment’s ground site in Laredo, Texas.NASA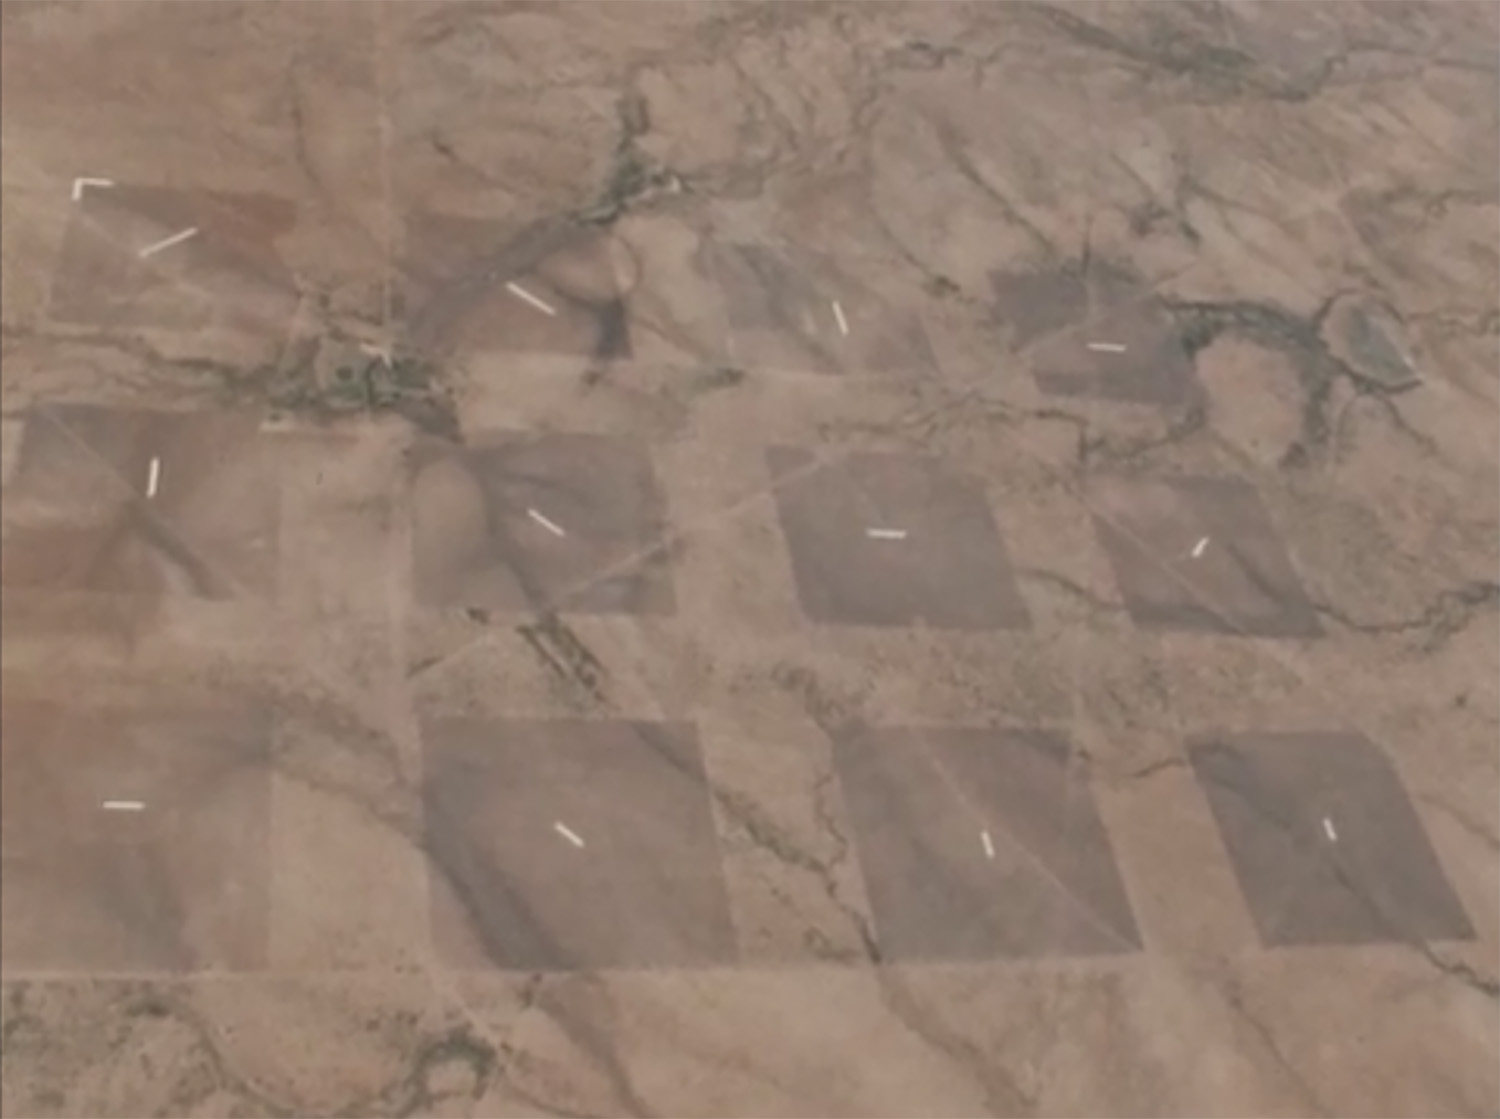
Their reports on the Laredo “Eye-Q” site, combined with the results of the binocular-like vision tester experiments conducted before, during, and after the flight, revealed that astronauts could in fact see roads and ships with following wakes from orbit. The experiments also determined that an astronaut’s vision did not deteriorate during a two-week spaceflight.1
Astronaut Frank Borman, Gemini VII command pilot, participates in a vision experiment using the in-flight visual acuity device during the two-week mission in December 1965.NASA Implications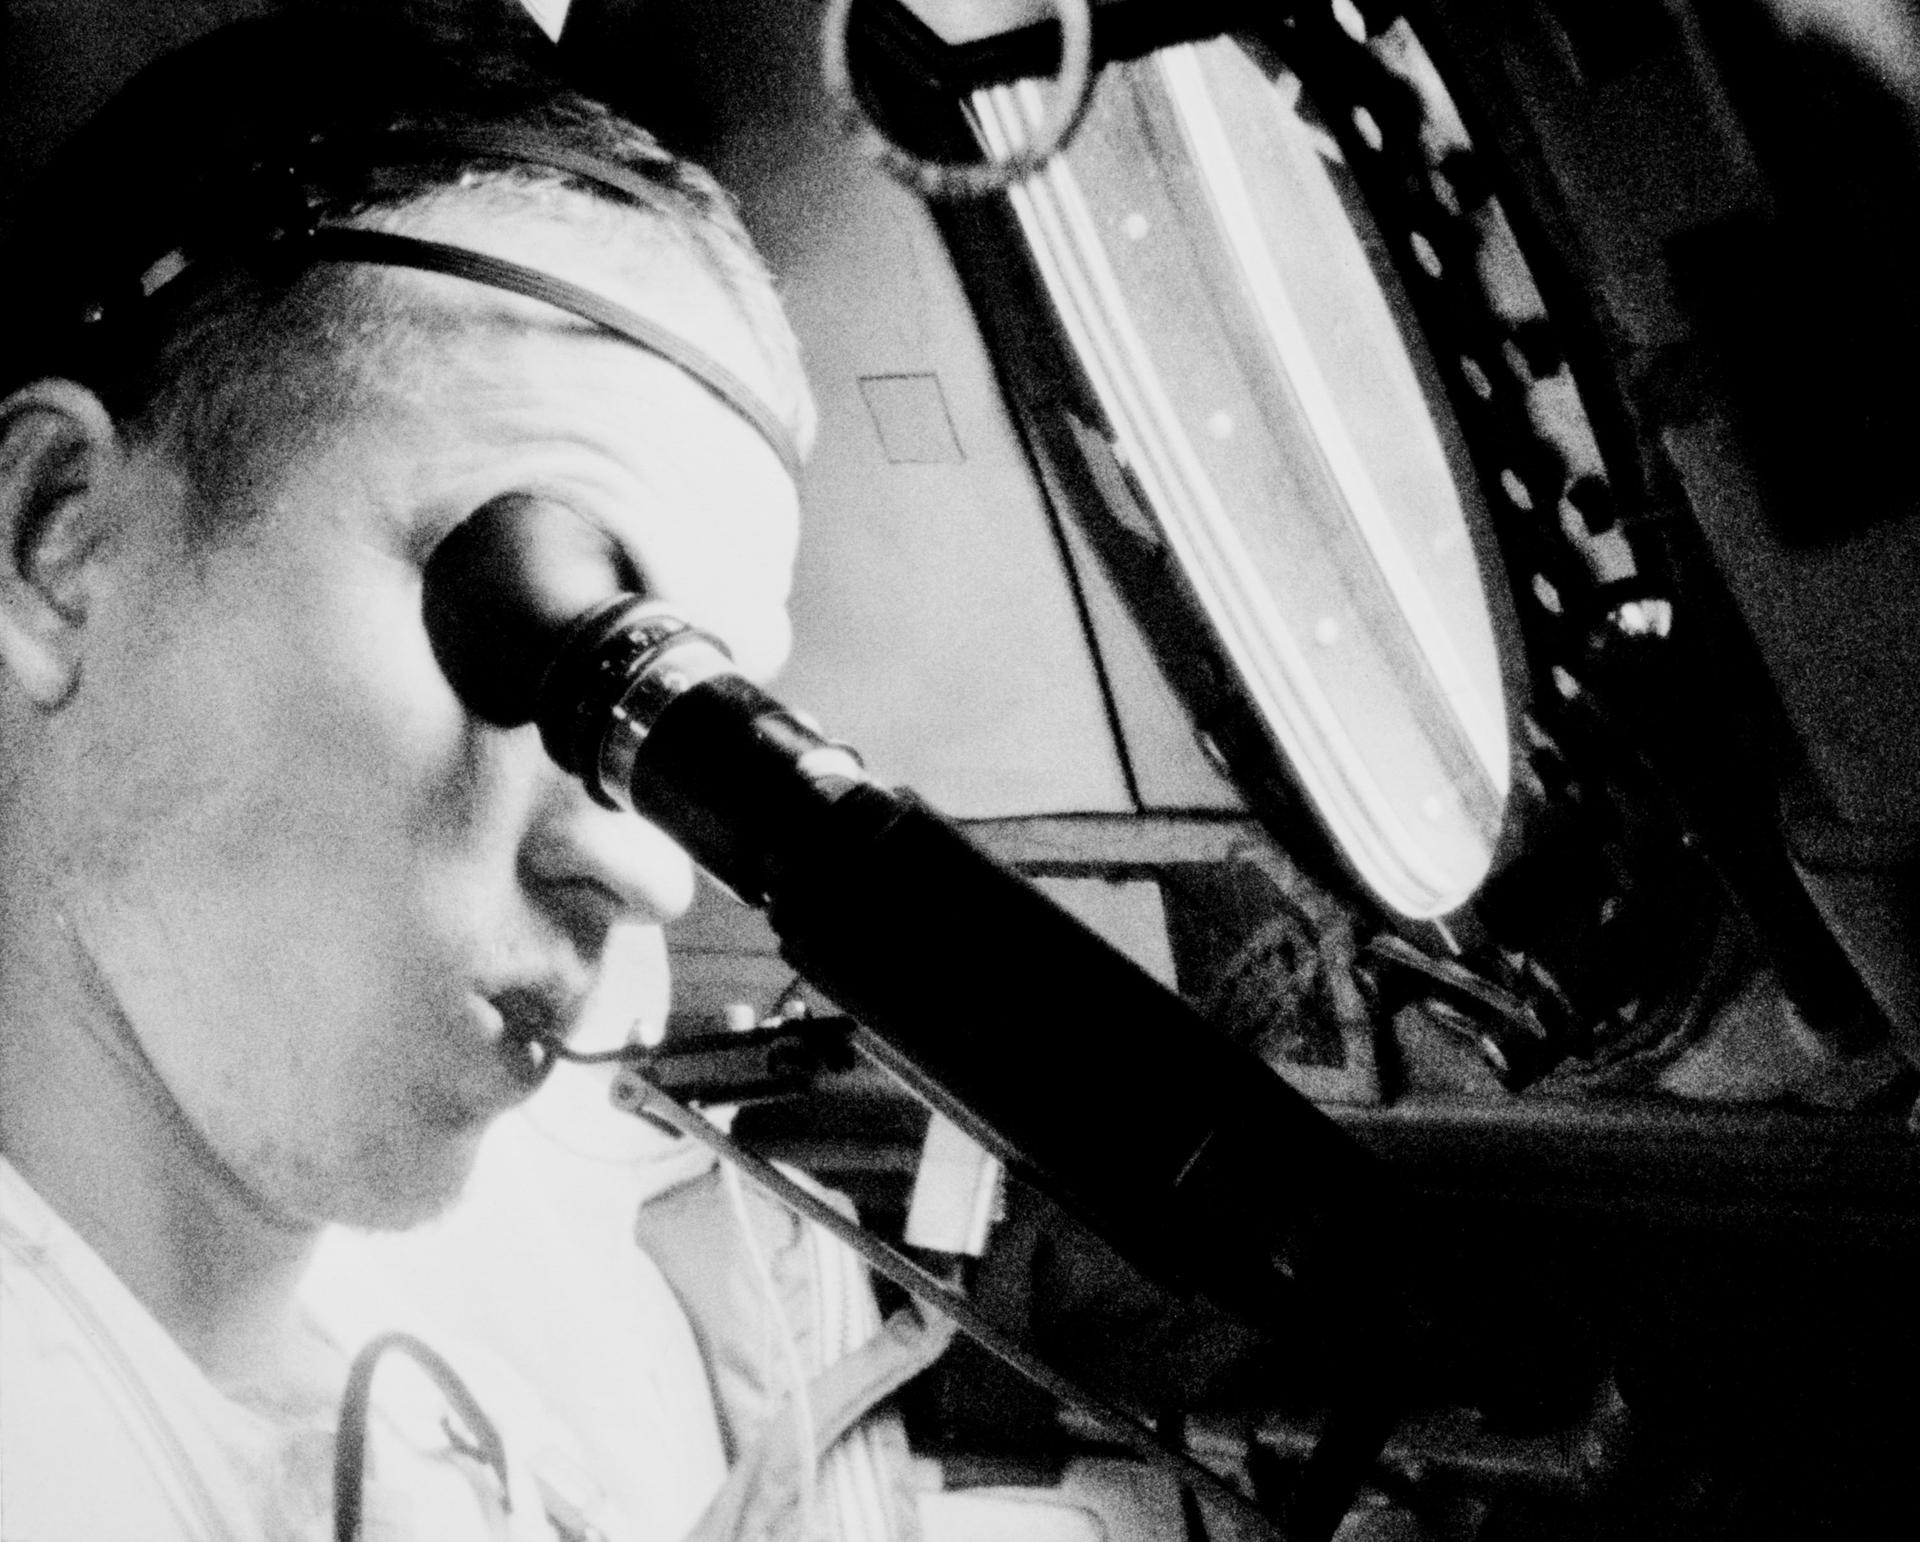
Determining what features on Earth astronauts could accurately see from orbit was about much more than sanity checking astronaut reports. Understanding what human eyes could see from space, as well as seeing the photographs taken on NASA’s early crewed missions had huge implications for geologists, geographers, oceanographers, and others studying our planet.
The scientific community’s interest in the recollections and photographs of the Earth’s surface as seen by the Mercury and Gemini astronauts motivated NASA and its partners to advocate for new Earth-observing instruments. NASA, the U.S. Geological Survey, the Office of Naval Research, and the U.S. Department of Agriculture noted that surface images of the Earth captured from above could be used to inventory crops, map geological features, monitor natural disasters, and better understand the ocean’s processes.
This photograph of the San Francisco Bay area of California was taken as part of the Skylab Earth Resources Experiment Package in January 1974.NASA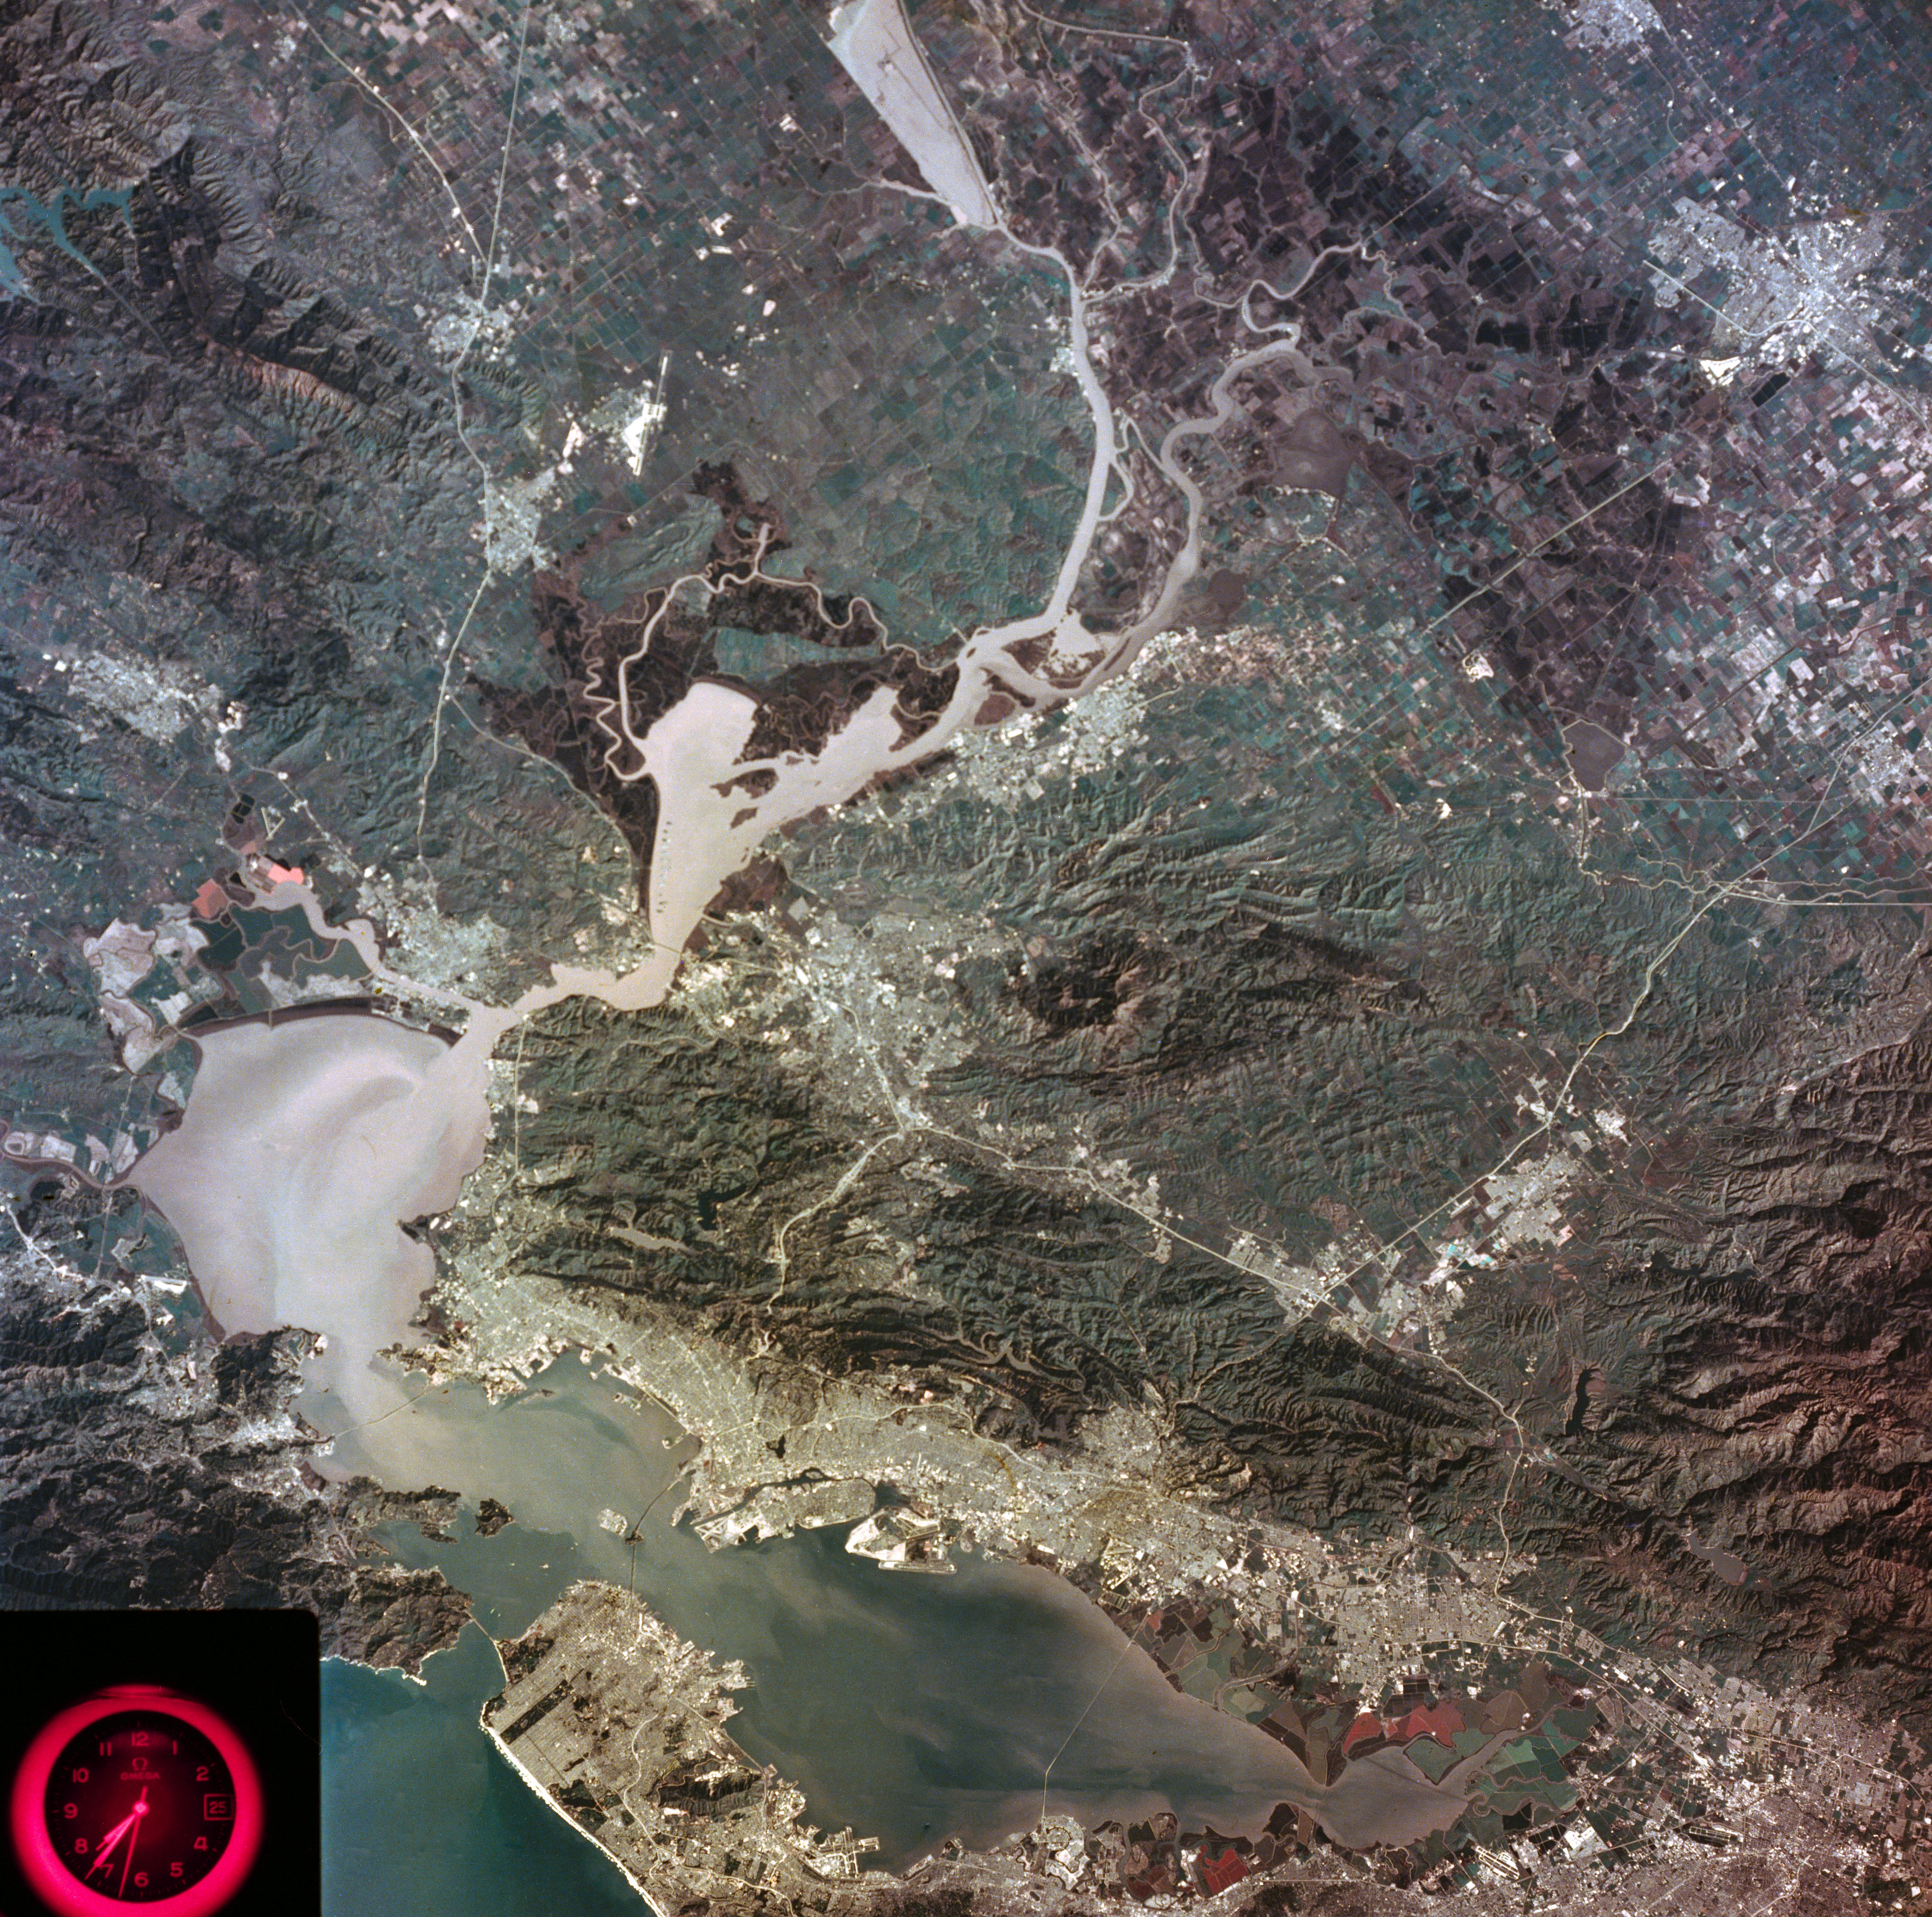
The promise of these real-world applications motivated the creation of the Earth Resources Technology Satellite (ERTS), later renamed Landsat 1. Launched by NASA in 1972, the data from Landsat 1’s camera and multi-spectral scanner were used along with data from the agency’s Earth Resources Aircraft Program to monitor the oceans, agricultural fields, natural disaster sites, and more.
In the six decades since America’s first pioneering human spaceflights, NASA has continued to observe the Earth from orbit, aircraft, and even ground level in a continuing quest to help solve problems here on Earth.
Note
[1] In subsequent years, scientists have documented that roughly 70% of astronauts experience Spaceflight Associated Neuro-ocular Syndrome (SANS) during longer spaceflights.
Share Details Last Updated Aug 19, 2026 Related Terms Explore More 3 min read How Early Astronaut Photographs Inspired the Landsat ProgramIn the 1960s, NASA was pioneering a new era of human spaceflight—and astronaut photography—that would…
Article 11 months ago 2 min read Observing Storms from Skylab Article 1 year ago 4 min read Playing the Moon GameApollo astronauts previewed their roles as lunar field geologists in Alaska’s Valley of Ten Thousand…
Article 2 months ago Keep Exploring Discover More Topics From NASANASA History
Human Research Program
Earth Observations
Project Gemini
The View from Above: The Gemini Visual Acuity Experiments
NASA astronaut L. Gordon Cooper, Jr. took 29 color photographs of the Earth with a 70mm camera as he orbited our planet during the Mercury-Atlas 9 mission in May 1963. Cooper’s view from the window of his Faith 7 spacecraft was spectacular, and he reported that he could see vehicles motoring on dirt roads, smoke-belching trains, and the tops of houses.
Researchers and members of the public had their doubts. Could Cooper actually see objects on the Earth’s surface in such fine detail while orbiting 100 miles above the planet? Some vision experts assumed that astronauts with 20/20 vision could not clearly see objects with sides less than 150 feet long at orbital altitudes. Although Cooper reportedly had exceptional 20/12 vision, certainly he could not see a white automobile kicking up a dust cloud near the U.S.-Mexico border as he claimed. Cooper, however, was not alone in his assertions. Other Mercury astronauts also reported seeing objects on the Earth in striking detail.
During his 22-orbit Mercury-Atlas 9 spaceflight in May 1963, L. Gordon Cooper Jr. took photos from the Faith 7 spacecraft including this one showing lakes in Western Tibet.NASAThese claims caused mental health professionals to question the sanity of NASA’s first astronauts. A story in Air Force and Space Digest noted that some psychiatrists speculated that “weightlessness was causing the astronauts to hallucinate and that the space program was in for serious trouble.” While mental health experts considered the effects of space flight on the brain, visual acuity experts mulled over the Mercury astronauts’ assertions and developed an experiment to determine what they could see on Earth from space.
Putting Astronaut Vision to the TestNASA and its partners developed two visual acuity experiments and conducted them during the crewed Gemini V and Gemini VII missions. The first experiment involved looking through an optical device reminiscent of binoculars. Test subjects looked through the eyepieces to see an assortment of rectangles in various positions and levels of contrast. They were then asked to identify the directional orientation of the rectangles.
Another part of the experiment involved creating two enormous terrestrial eye charts composed of gigantic white rectangles. The rectangles, created by the Dow Chemical Corporation, ranged in size from roughly 150 to 600 feet long. The experiment team placed one set of rectangles on dark tilled soil in Laredo, Texas and another near Carnarvon, Australia, and asked Gemini V and VII astronauts to identify their directional orientation from orbit. This visual acuity tool was nicknamed the “Eye-Q” chart.
In-Flight Vision Testing InstrumentDrawing illustrating a Gemini astronaut using the In-Flight Vision Tester.NASA Gemini V Visual Acuity ExperimentThis illustration shows the intended orientation of the Gemini spacecraft as it orbited over the “Eye-Q” ground observation sites.NASACloudy conditions, sunlight scattered by the window of the Gemini spacecraft, and unfavorable orbital orientations during overflight all impacted the astronauts’ views of the ground-based experiments. Nevertheless, during some orbital revolutions, astronauts on both missions were able to see portions of the ground site near Laredo.
Aerial view of the visual acuity experiment’s ground site in Laredo, Texas.NASATheir reports on the Laredo “Eye-Q” site, combined with the results of the binocular-like vision tester experiments conducted before, during, and after the flight, revealed that astronauts could in fact see roads and ships with following wakes from orbit. The experiments also determined that an astronaut’s vision did not deteriorate during a two-week spaceflight.1
Astronaut Frank Borman, Gemini VII command pilot, participates in a vision experiment using the in-flight visual acuity device during the two-week mission in December 1965.NASA ImplicationsDetermining what features on Earth astronauts could accurately see from orbit was about much more than sanity checking astronaut reports. Understanding what human eyes could see from space, as well as seeing the photographs taken on NASA’s early crewed missions had huge implications for geologists, geographers, oceanographers, and others studying our planet.
The scientific community’s interest in the recollections and photographs of the Earth’s surface as seen by the Mercury and Gemini astronauts motivated NASA and its partners to advocate for new Earth-observing instruments. NASA, the U.S. Geological Survey, the Office of Naval Research, and the U.S. Department of Agriculture noted that surface images of the Earth captured from above could be used to inventory crops, map geological features, monitor natural disasters, and better understand the ocean’s processes.
This photograph of the San Francisco Bay area of California was taken as part of the Skylab Earth Resources Experiment Package in January 1974.NASAThe promise of these real-world applications motivated the creation of the Earth Resources Technology Satellite (ERTS), later renamed Landsat 1. Launched by NASA in 1972, the data from Landsat 1’s camera and multi-spectral scanner were used along with data from the agency’s Earth Resources Aircraft Program to monitor the oceans, agricultural fields, natural disaster sites, and more.
In the six decades since America’s first pioneering human spaceflights, NASA has continued to observe the Earth from orbit, aircraft, and even ground level in a continuing quest to help solve problems here on Earth.
Note
[1] In subsequent years, scientists have documented that roughly 70% of astronauts experience Spaceflight Associated Neuro-ocular Syndrome (SANS) during longer spaceflights.
Share Details Last Updated Aug 19, 2026 Related Terms Explore More 3 min read How Early Astronaut Photographs Inspired the Landsat ProgramIn the 1960s, NASA was pioneering a new era of human spaceflight—and astronaut photography—that would…
Article 11 months ago 2 min read Observing Storms from Skylab Article 1 year ago 4 min read Playing the Moon GameApollo astronauts previewed their roles as lunar field geologists in Alaska’s Valley of Ten Thousand…
Article 2 months ago Keep Exploring Discover More Topics From NASANASA History
Human Research Program
Earth Observations
Project Gemini
NASA Data Feeds River Forecasts as Snow Drought Effects Linger
- Earth
- Explore
- Science at Work
- Multimedia
- Data
- For Researchers
- About Us
As the effects of the 2026 snow drought in the western United States carry into summer, NASA Earth data is feeding machine-learning forecasts that inform decisions about water, power, and public safety in Washington state.
Tacoma Power, a Washington public utility, is using a U.S. technology company’s river-flow forecasts during a year of water extremes on the Cowlitz River. The utility’s largest hydroelectric project uses water stored behind Mayfield and Mossyrock dams to generate enough electricity to serve more than 151,000 homes each year.
Upstream Tech’s HydroForecast combines weather forecasts and river measurements with NASA-produced satellite data on snow cover and vegetation conditions to predict river flow from hours to days ahead. Updated every two hours, the forecasts are used by reservoir managers, hydropower producers, water utilities, and government agencies to prepare for storms, plan reservoir water releases, and navigate dry periods.
“Part of NASA’s mission is to make the view from space useful on the ground,” said Erin Urquhart, manager for NASA’s Water Resources program at the agency’s headquarters in Washington, D.C. “When an American company incorporates NASA’s freely available data into forecasts that help water managers prepare for floods, generate power, and steward water supplies, that’s NASA delivering practical value to the nation.”
Year of water extremesDuring the winter of 2025-26, unusual warmth meant a larger share of precipitation fell as rain instead of snow across much of the West, while below-normal precipitation deepened deficits in some areas. January, February, and March each had the lowest Western snow cover for that month in the NASA MODIS (Moderate Resolution Imaging Spectroradiometer) satellite record since 2001.
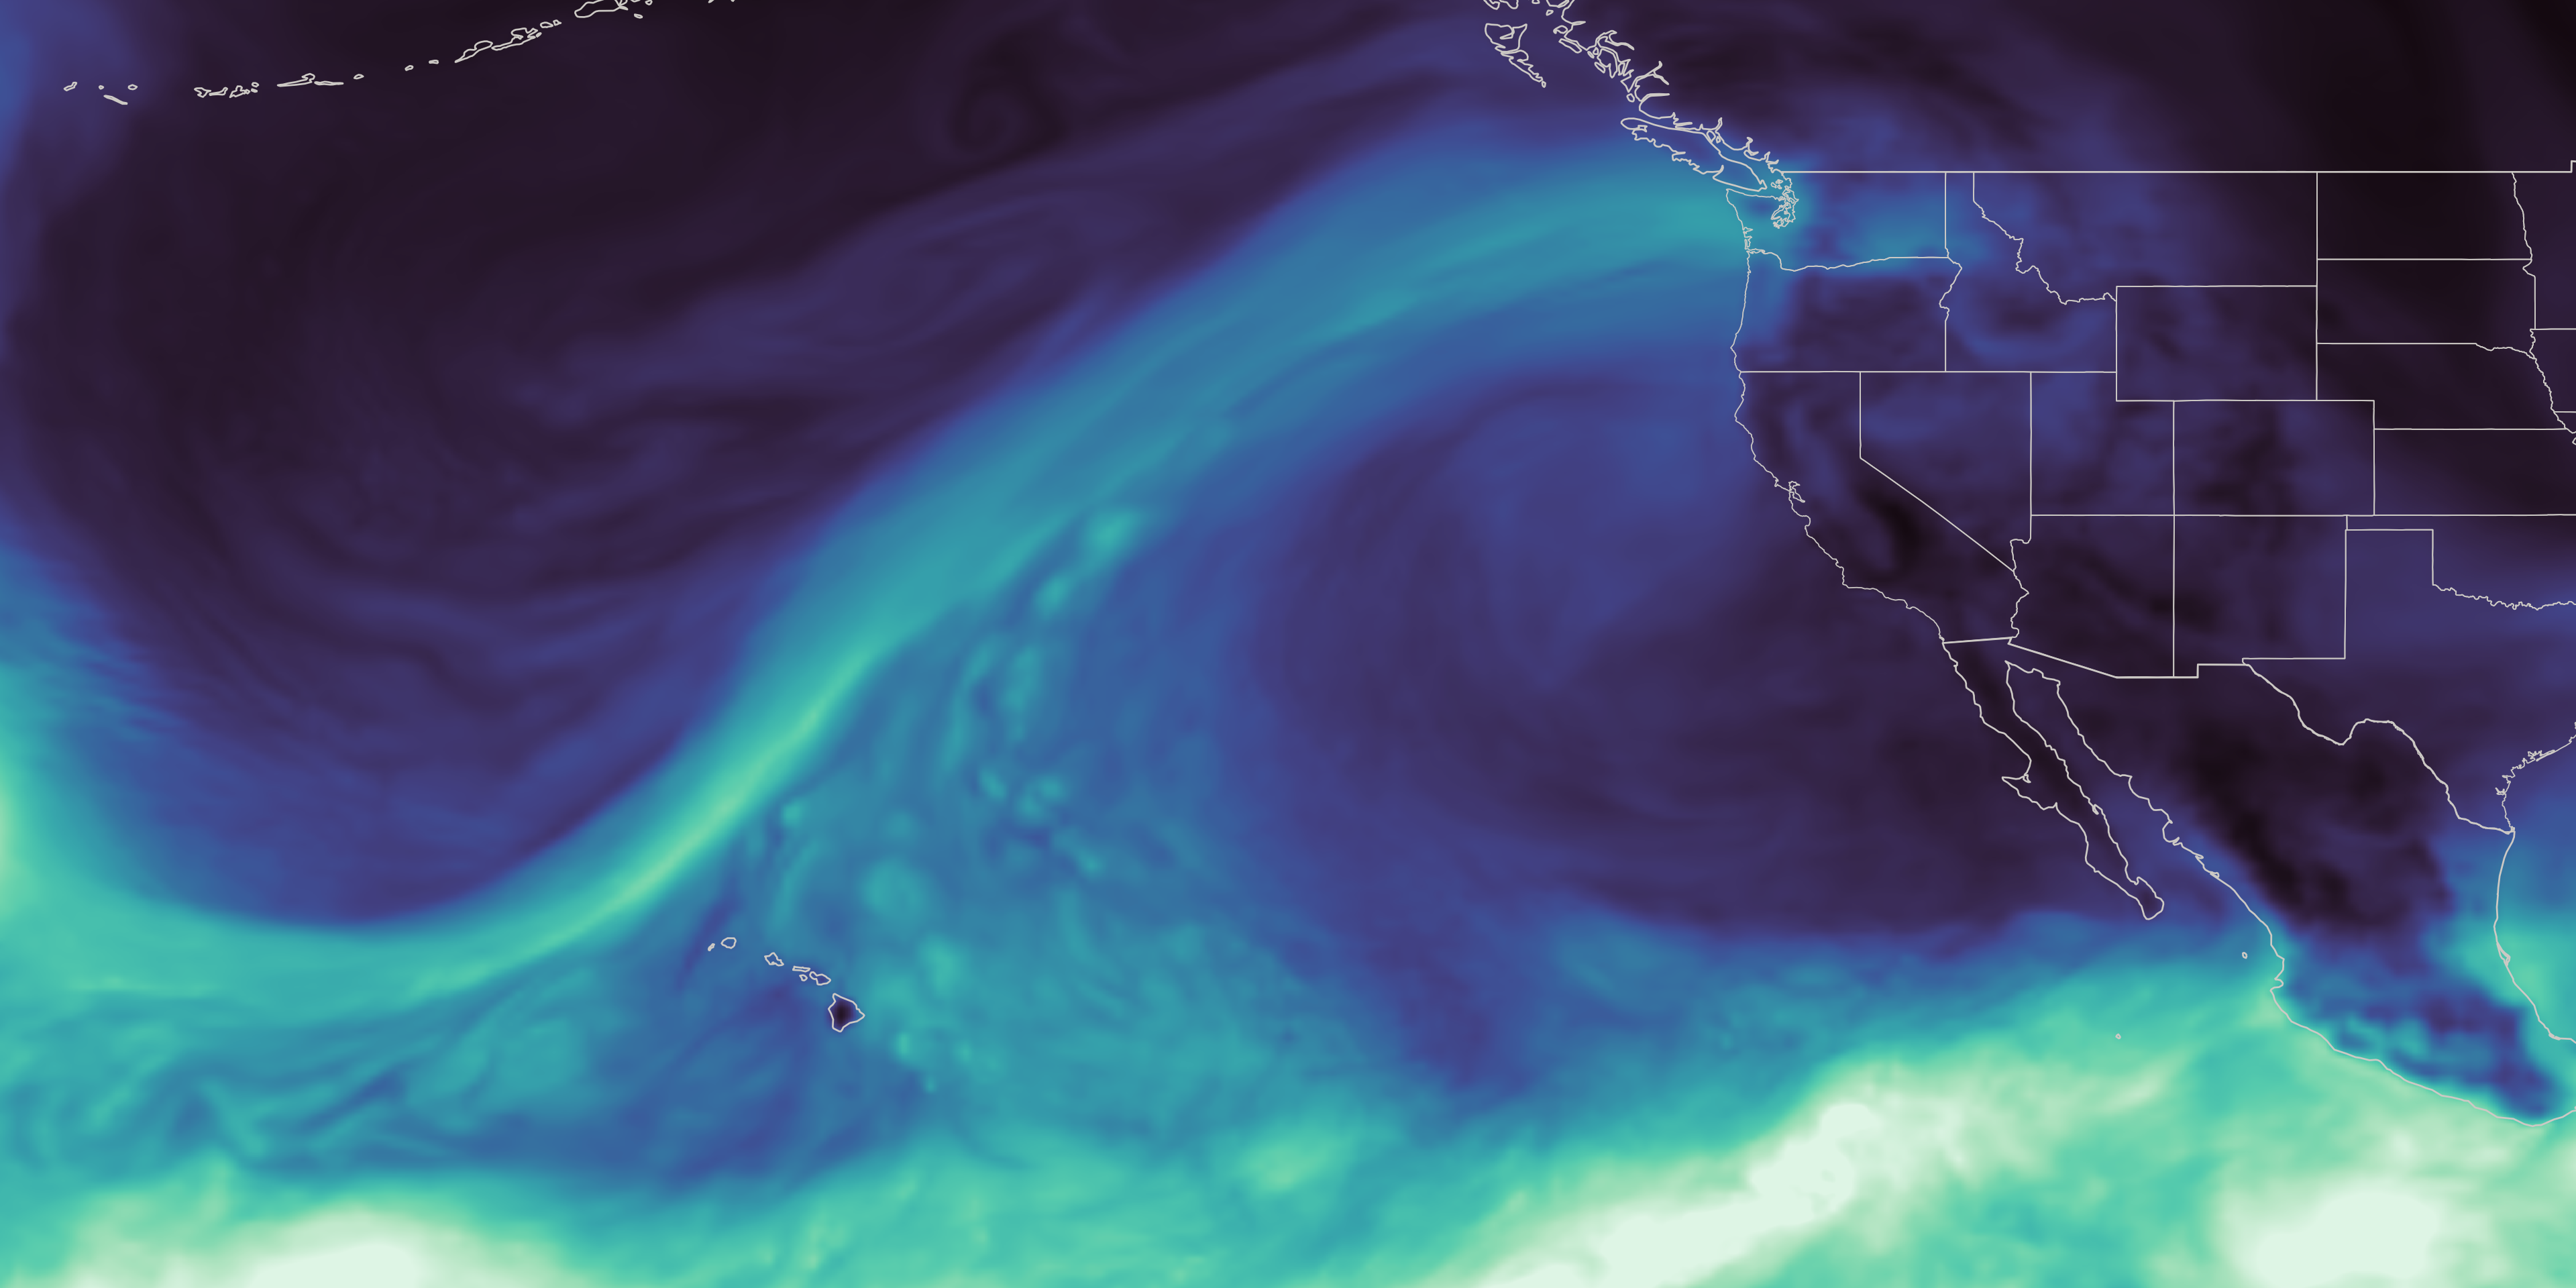
On the Cowlitz, those conditions produced a season of extremes. In December 2025, a powerful atmospheric river brought a long, narrow band of Pacific moisture into the region, causing one of the largest one-day inflow surges ever recorded at Tacoma Power’s hydroelectric project. Across the season, that rain-heavy pattern sent water downstream quickly instead of building mountain snowpack that would melt and release water steadily into summer. Snowpack remained at just 20% to 50% of normal levels.
As winter became spring, the rain tapered off, and on April 8, Washington state placed every watershed, including the Cowlitz, under a drought emergency. From April through June, peak daily inflow into the project was among the lowest on record, leaving Tacoma Power with less incoming water to replenish its reservoirs ahead of summer demand, said Saul Villarreal, Tacoma Power’s senior hydro operations manager.
Tacoma Power’s Mayfield Dam and powerhouse sit on the Cowlitz River in southwest Washington, where forecasts using NASA data support reservoir operations and hydropower generation.Tacoma Power, used with permission Turning satellite data into river forecasts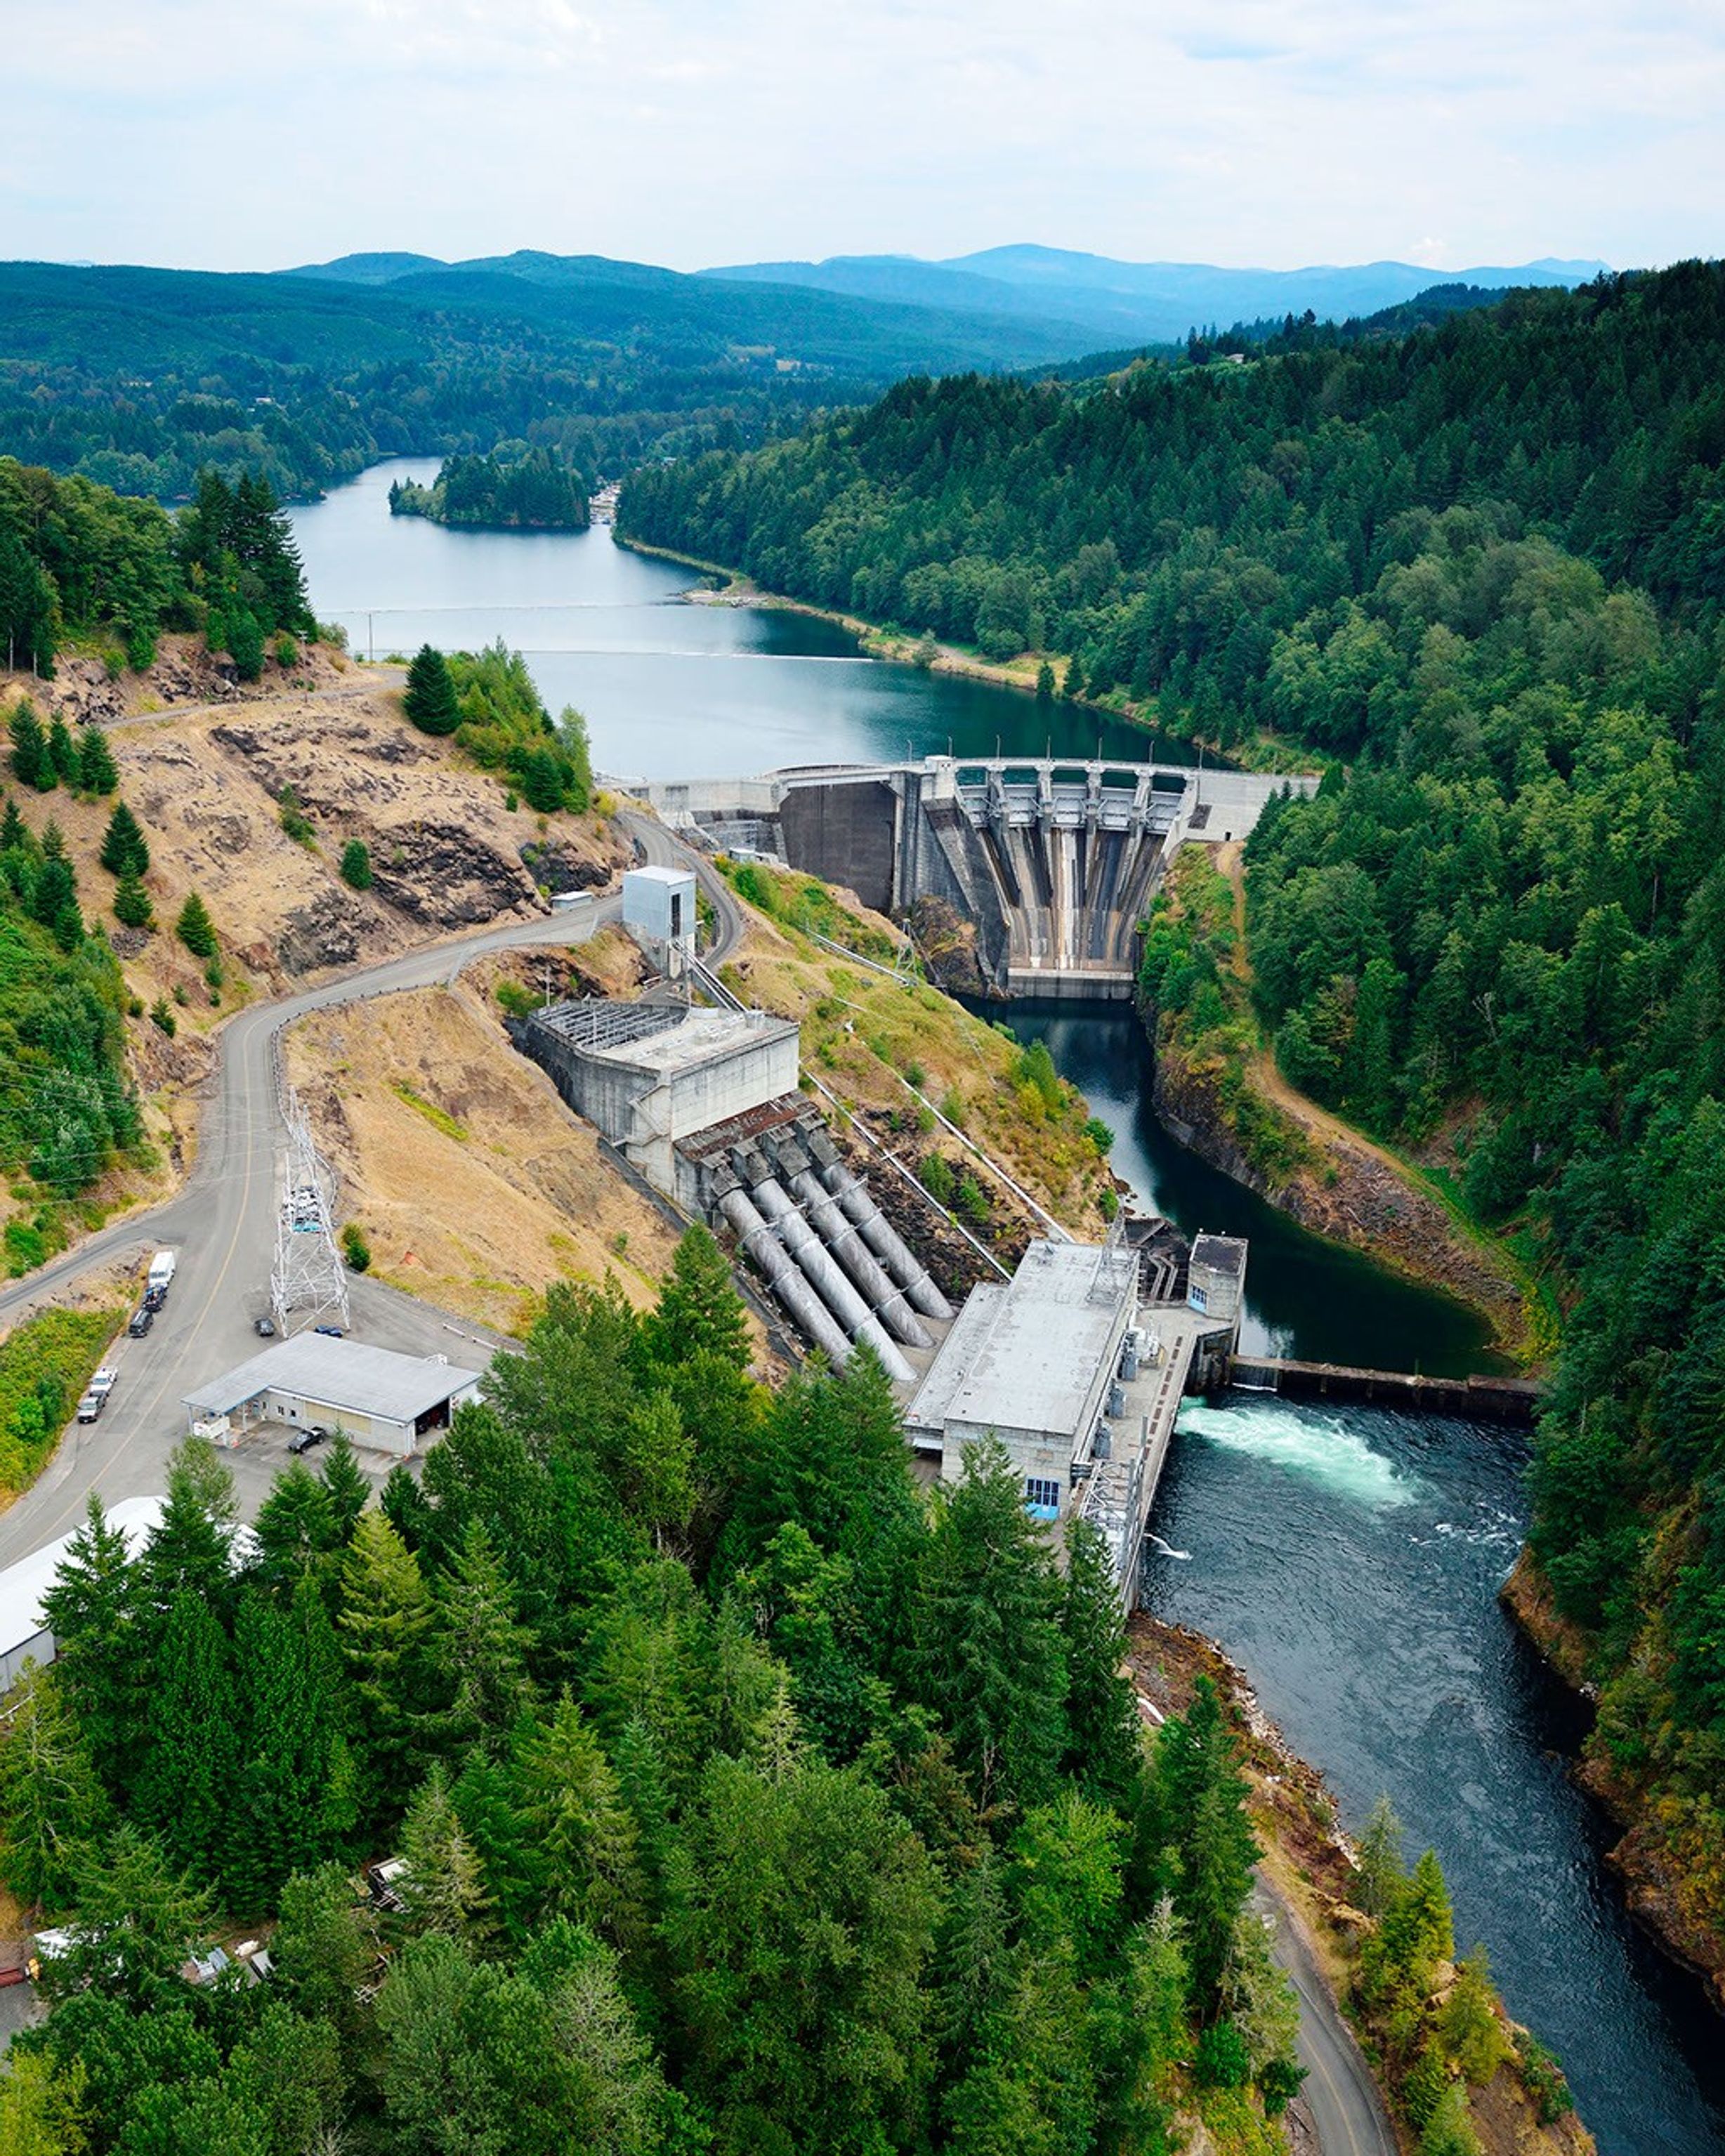
NASA turns observations collected by the VIIRS (Visible Infrared Imaging Radiometer Suite) instrument on the Suomi-NPP (Suomi National Polar-orbiting Partnership) satellite into data products that provide information about snow cover and vegetation greenness across entire watersheds, including where ground monitors are sparse.
To train HydroForecast, Upstream Tech collects and archives years of those NASA products alongside weather forecast data and actual river-flow measurements. Using records from hundreds of watersheds, the models learn common patterns in how water moves through the landscape and apply them in new locations.
Tests across multiple basins found that including snow and vegetation observations increased forecast skill, said Dr. Laura Read, director of technical and federal partnerships for HydroForecast at Upstream Tech. “NASA’s data gives us the reliability, global coverage, and consistency we need,” said Read. “Our short-term models run every two hours, so those inputs have to show up when we need them. Though we have stopgaps in place, any interruption to our operational pipeline is a huge deal.”
Tacoma Power uses HydroForecast alongside stream gauges, snow stations, and operator judgment. During the December storm, the NASA-informed, short-term forecast helped the utility anticipate how much water would reach the project and prepare for dynamic river conditions, while meeting operating requirements and keeping public safety at the forefront, Villarreal said.
To view this video please enable JavaScript, and consider upgrading to a web browser that supports HTML5 video
NASA’s GEOS (Goddard Earth Observing System) maps an atmospheric river, a ribbon of water vapor, before Washington’s January-April 2026 snow cover is compared with a historical median.NASA’s Scientific Visualization StudioAs spring approached, the operational challenge reversed. Tacoma Power used HydroForecast’s seasonal model to track the growing risk of weak runoff and began keeping its reservoirs higher than usual to preserve water for summer. That left less space to contain another large storm, so operators continued checking the short-term forecast “to play defense,” and remained ready to adjust operations if another atmospheric river developed.
“The earlier we understand how conditions might change, the more effective planning we can do to manage our reservoir and balance the many demands of our system throughout the season,” said Villarreal.
Tacoma Power entered summer 2026 with reservoir levels near average despite the dry spring. The stored water supports reliable hydropower, required river flows to support fish and aquatic habitat, and public recreation. It also gives the utility more flexibility to meet electricity demand during heat waves or unexpected outages and, when possible, support the wider regional power system.
From forecasts to drought assessmentsTacoma Public Utilities’ Cowlitz Hydro Project is just one example of NASA science supporting water decisions across the West.
NASA also has partnered with the U.S. Department of Agriculture’s Natural Resources Conservation Service to bring satellite-based snow and groundwater information into machine-learning water-supply forecasts.
The National Oceanic and Atmospheric Administration’s Colorado Basin River Forecast Center uses MODIS and VIIRS data to adjust snowmelt rates in its model. The Bureau of Reclamation uses NASA and NASA-derived snow data, alongside other sources, for reservoir operations in California’s San Joaquin Basin.
NASA data and research have long informed the U.S. Drought Monitor, the weekly assessment used by farmers, water managers, and public agencies. NASA became a formal partner in 2026, expanding its role from providing information to helping produce the assessment. The agency took its first turn authoring the Drought Monitor during the week of Aug. 17.
Discover more about NASA’s drought work About the AuthorEmily DeMarcoWriter/Editor (IV), Earth Science DivisionEmily is a science writer and editor with NASA’s Earth Science Division, with more than 10 years of experience in science journalism and communication. A former deputy news editor at the magazine Science News, she holds a master’s in environmental science and management from UC Santa Barbara’s Bren School, where she specialized in water resources management and science communication.
Share Details Last Updated Aug 20, 2026 Related Terms Explore More 4 min read An Uncommon Drifter in the Denmark StraitIn summer 2026, a large iceberg drifted more than 1,000 kilometers south from the northeastern…
Article 11 hours ago 5 min read Human-Related Microbes May Survive Moon’s South Pole, NASA Finds Article 21 hours ago 3 min read Elephant Butte Reservoir Runs LowDrought in the Rio Grande basin contributed to New Mexico’s largest reservoir dwindling to its…
Article 1 day ago Keep Exploring Discover More Topics From NASA Earth ActionAccelerating the use of Earth observation data for decision-making.
FreshwaterWater drives life, economies, and security — and NASA tracks its constant motion as it shifts between sea, land, and…
Earth Science at WorkNASA Earth Science helps Americans respond to challenges and societal needs — such as wildland fires, hurricanes, and water supplies…
Water ResourcesSupporting sustainable and adaptable water resources management.
NASA Data Feeds River Forecasts as Snow Drought Effects Linger
- Earth
- Explore
- Science at Work
- Multimedia
- Data
- For Researchers
- About Us
As the effects of the 2026 snow drought in the western United States carry into summer, NASA Earth data is feeding machine-learning forecasts that inform decisions about water, power, and public safety in Washington state.
Tacoma Power, a Washington public utility, is using a U.S. technology company’s river-flow forecasts during a year of water extremes on the Cowlitz River. The utility’s largest hydroelectric project uses water stored behind Mayfield and Mossyrock dams to generate enough electricity to serve more than 151,000 homes each year.
Upstream Tech’s HydroForecast combines weather forecasts and river measurements with NASA-produced satellite data on snow cover and vegetation conditions to predict river flow from hours to days ahead. Updated every two hours, the forecasts are used by reservoir managers, hydropower producers, water utilities, and government agencies to prepare for storms, plan reservoir water releases, and navigate dry periods.
“Part of NASA’s mission is to make the view from space useful on the ground,” said Erin Urquhart, manager for NASA’s Water Resources program at the agency’s headquarters in Washington, D.C. “When an American company incorporates NASA’s freely available data into forecasts that help water managers prepare for floods, generate power, and steward water supplies, that’s NASA delivering practical value to the nation.”
Year of water extremesDuring the winter of 2025-26, unusual warmth meant a larger share of precipitation fell as rain instead of snow across much of the West, while below-normal precipitation deepened deficits in some areas. January, February, and March each had the lowest Western snow cover for that month in the NASA MODIS (Moderate Resolution Imaging Spectroradiometer) satellite record since 2001.
On the Cowlitz, those conditions produced a season of extremes. In December 2025, a powerful atmospheric river brought a long, narrow band of Pacific moisture into the region, causing one of the largest one-day inflow surges ever recorded at Tacoma Power’s hydroelectric project. Across the season, that rain-heavy pattern sent water downstream quickly instead of building mountain snowpack that would melt and release water steadily into summer. Snowpack remained at just 20% to 50% of normal levels.
As winter became spring, the rain tapered off, and on April 8, Washington state placed every watershed, including the Cowlitz, under a drought emergency. From April through June, peak daily inflow into the project was among the lowest on record, leaving Tacoma Power with less incoming water to replenish its reservoirs ahead of summer demand, said Saul Villarreal, Tacoma Power’s senior hydro operations manager.
Tacoma Power’s Mayfield Dam and powerhouse sit on the Cowlitz River in southwest Washington, where forecasts using NASA data support reservoir operations and hydropower generation.Tacoma Power, used with permission Turning satellite data into river forecastsNASA turns observations collected by the VIIRS (Visible Infrared Imaging Radiometer Suite) instrument on the Suomi-NPP (Suomi National Polar-orbiting Partnership) satellite into data products that provide information about snow cover and vegetation greenness across entire watersheds, including where ground monitors are sparse.
To train HydroForecast, Upstream Tech collects and archives years of those NASA products alongside weather forecast data and actual river-flow measurements. Using records from hundreds of watersheds, the models learn common patterns in how water moves through the landscape and apply them in new locations.
Tests across multiple basins found that including snow and vegetation observations increased forecast skill, said Dr. Laura Read, director of technical and federal partnerships for HydroForecast at Upstream Tech. “NASA’s data gives us the reliability, global coverage, and consistency we need,” said Read. “Our short-term models run every two hours, so those inputs have to show up when we need them. Though we have stopgaps in place, any interruption to our operational pipeline is a huge deal.”
Tacoma Power uses HydroForecast alongside stream gauges, snow stations, and operator judgment. During the December storm, the NASA-informed, short-term forecast helped the utility anticipate how much water would reach the project and prepare for dynamic river conditions, while meeting operating requirements and keeping public safety at the forefront, Villarreal said.
To view this video please enable JavaScript, and consider upgrading to a web browser that supports HTML5 video
NASA’s GEOS (Goddard Earth Observing System) maps an atmospheric river, a ribbon of water vapor, before Washington’s January-April 2026 snow cover is compared with a historical median.NASA’s Scientific Visualization StudioAs spring approached, the operational challenge reversed. Tacoma Power used HydroForecast’s seasonal model to track the growing risk of weak runoff and began keeping its reservoirs higher than usual to preserve water for summer. That left less space to contain another large storm, so operators continued checking the short-term forecast “to play defense,” and remained ready to adjust operations if another atmospheric river developed.
“The earlier we understand how conditions might change, the more effective planning we can do to manage our reservoir and balance the many demands of our system throughout the season,” said Villarreal.
Tacoma Power entered summer 2026 with reservoir levels near average despite the dry spring. The stored water supports reliable hydropower, required river flows to support fish and aquatic habitat, and public recreation. It also gives the utility more flexibility to meet electricity demand during heat waves or unexpected outages and, when possible, support the wider regional power system.
From forecasts to drought assessmentsTacoma Public Utilities’ Cowlitz Hydro Project is just one example of NASA science supporting water decisions across the West.
NASA also has partnered with the U.S. Department of Agriculture’s Natural Resources Conservation Service to bring satellite-based snow and groundwater information into machine-learning water-supply forecasts.
The National Oceanic and Atmospheric Administration’s Colorado Basin River Forecast Center uses MODIS and VIIRS data to adjust snowmelt rates in its model. The Bureau of Reclamation uses NASA and NASA-derived snow data, alongside other sources, for reservoir operations in California’s San Joaquin Basin.
NASA data and research have long informed the U.S. Drought Monitor, the weekly assessment used by farmers, water managers, and public agencies. NASA became a formal partner in 2026, expanding its role from providing information to helping produce the assessment. The agency took its first turn authoring the Drought Monitor during the week of Aug. 17.
Discover more about NASA’s drought work About the AuthorEmily DeMarcoWriter/Editor (IV), Earth Science DivisionEmily is a science writer and editor with NASA’s Earth Science Division, with more than 10 years of experience in science journalism and communication. A former deputy news editor at the magazine Science News, she holds a master’s in environmental science and management from UC Santa Barbara’s Bren School, where she specialized in water resources management and science communication.
Share Details Last Updated Aug 20, 2026 Related Terms Explore More 4 min read An Uncommon Drifter in the Denmark StraitIn summer 2026, a large iceberg drifted more than 1,000 kilometers south from the northeastern…
Article 11 hours ago 5 min read Human-Related Microbes May Survive Moon’s South Pole, NASA Finds Article 21 hours ago 3 min read Elephant Butte Reservoir Runs LowDrought in the Rio Grande basin contributed to New Mexico’s largest reservoir dwindling to its…
Article 1 day ago Keep Exploring Discover More Topics From NASA Earth ActionAccelerating the use of Earth observation data for decision-making.
FreshwaterWater drives life, economies, and security — and NASA tracks its constant motion as it shifts between sea, land, and…
Earth Science at WorkNASA Earth Science helps Americans respond to challenges and societal needs — such as wildland fires, hurricanes, and water supplies…
Water ResourcesSupporting sustainable and adaptable water resources management.
Life’s ‘last universal common ancestor’ may predate life itself
A groundbreaking study hints at a hazy boundary between “life” and “non-life,” as well as two distinct origins of biology on Earth
Try not to be hypnotized by the 'Eye of Africa' | Space photo of the day for Aug. 20, 2026
The "Eye of Africa" swirls across Mauritania in a hypnotizing snapshot captured from space.
What is it?A 25-mile-wide (40 kilometer-wide) circular structure made up of concentric ridged rings sticks up from the Earth in Mauritania, a country on the coast of northwestern Africa. While it might look like an elaborate, hand-carved piece of artwork, it's actually a natural geologic feature.
Formally known as the Richat Structure and nicknamed the "Eye of Africa," this geologic formation can be seen clearly from space.
The first time this feature was seen from space was in 1965 when NASA astronauts Ed White and James McDivitt photographed it during the Gemini IV mission.
61 years later, NASA astronaut Jessica Meir has photographed the feature from aboard the International Space Station where she is working as part of Expedition 75.
Why is it incredible?Meir shared the photo of the structure on social media along with other photographs from that region.
"The Richat Structure (or Eye of Africa) in Mauritania is photographed from above by many astronauts, but something about the lighting and coloring on this day captured my artistic eye. This palette and textures of this region of Africa scream pure Earth Art, at least in my brain!" Meir said in the post where she shared her photos.
Amazingly, because of its massive size, this geologic feature is perhaps most clearly seen from space. While astronauts aboard the ISS are orbiting our planet from hundreds of miles away, theit vantage point actually allows them to see the full, expansive circles that make up the "Eye of Africa." And while we've been seeing it from space since 1965, the view really never gets old.
On this day in space! Aug. 20, 1977: Voyager 2 launches to the outer planets
On Aug. 20, 1977, NASA launched the Voyager 2 spacecraft on a mission to explore the outer planets. Despite its name, this was the first of the two Voyager missions NASA launched that year.
Voyager 2: Sailing Among Giant Planets
Thanks to a rare alignment of the planets, NASA had the opportunity to send a spacecraft on an unprecedented journey to Jupiter, Saturn, Uranus and Neptune.While Voyager 1 ended its planetary mission after Saturn, Voyager 2 completed a 12-year journey to Neptune. But they didn't stop there!
Voyager 1 left the solar system and entered interstellar space in 2012, and Voyager 2 followed suit in 2018. As it approaches 50 years of operation, the probe continues to return data from three functioning science instruments.
NASA's Voyager 2 launched on Aug. 20, 1977. (Image credit: NASA)Why it matteredNearly half a century later, it remains the only spacecraft to visit all four has giants in our solar system, and the only spacecraft humanity has ever sent past Uranus and Neptune. Some of Voyager 2’s biggest surprises came from the moons orbiting those planets. Its images of Neptune’s largest moon, Triton, revealed active geyser-like plumes blasting nitrogen miles above the surface — making it one of only three geologically active moons in the solar system (maybe four, depending on what Europa Clipper finds).
Decades beyond its original mission, Voyager 2 has begun studying the Kuiper Belt environment beyond the Sun’s protective heliosphere, giving scientists measurements from a region no spacecraft had been designed to reach. Voyager 2's plutonium power supply drops in efficiency about four watts per year, and NASA engineers were recently able to reduce how much power Voyager 2 needs by switching off a number of non-science components to adapt a less demanding method of warming the spacecraft while it continues traveling ever farther away from the sun.
China’s Chang’e 7 moonshot will seek water ice at the lunar south pole
The country’s latest mission, Chang’e 7, will be the first ever to land directly at the moon’s south pole. Whatever it finds there could radically reshape a new space race
James Webb Space Telescope finds 'hidden stars' making the universe's 1st galaxies much bigger than we knew
Imagine looking at a vast city on Earth from a great distance, knowing nothing about that city; you may assume that its only buildings are the largest, most visible skyscrapers. But, get closer or look with a far more powerful tool, and you would begin to discover smaller buildings between mountainous skyscrapers.
Now, the James Webb Space Telescope has discovered that this looks like that is a fitting analogy for early galaxies.
Astronomers are finding that in between the brightest stars, the 'tallest skyscrapers' in the above analogy, there are much fainter stars analogous to smaller buildings. That means early galaxies may actually have a lot more mass packed into them than we believed.
The team behind this research reached this conclusion by using the James Webb Space Telescope (JWST) to study nine early galaxies that have passed through their period of intense star formation. They combined this data with observations from the Very Large Telescope (VLT) here on Earth to measure the population of small and faint stars in these galaxies for the first time. What they found was that the proportion of small stars in these galaxies is much greater than is found in modern galaxies like the Milky Way. This comes as something of a surprise to scientists who have assumed these populations would be similar.
"This means that the galaxy as a whole is much more massive than previous estimates suggested," team member Chloe Cheng of Leiden University, Netherlands, said in a statement.
The first 'cosmic cities' weren't dominated by skyscrapers, it just looks that wayAstronomers study galaxies and calculate their stellar population rates using the total light, or spectrum, coming from these cosmic metropolises. The problem is, the more massive a star is, the brighter it is. Thus, the overall spectrum of a galaxy is dominated by the most massive stars, while smaller stars are drowned out.
The sensitivity of the JWST has allowed astronomers to finally give these smaller stars a chance to shine and stand out, like spotting an incredible piece of architecture in a vast metropolis of glass and steel.
"Until recently, this type of measurement was simply not possible," team member Martje Slob of Leiden University said. "We needed not only a telescope that collects sufficient light, but also spectra of exceptional quality and new analysis techniques to reliably distinguish the subtle features of small stars."
The team's discovery has implications for our understanding of young galaxies in the early universe. This is because scientists had always assumed the stars of different masses were born in the same proportion across cosmic history. Now that seemingly isn't the case.
That is especially true if more early galaxies are like one particularly striking example examined in this study. This galaxy, which formed less than 1.5 billion years after the Big Bang, contains up to four times the mass previously estimated thanks to its huge population of smaller stars.
Thus, our models of galaxy formation may need some serious revision in the near future.
"This result shows that much more mass than previously thought is hidden in small stars," team leader Mariska Kriek of Leiden University said. "That has implications for all kinds of fields within astronomy. Because many planets orbit small stars, it could even mean that more planets formed in the early universe than we previously assumed."
An illustration of the JWST which continues to break new ground in astronomy. (Image credit: Robert Lea (created with Canva))The team now intends to apply this method to more of the universe's earliest galaxies, hoping to stretch their investigation back to the universe's first stars.
The team's research was published on Wednesday (August 18) in the journal Nature Astronomy.
Should you be taking testosterone?
Testosterone is a longtime favorite of the bodybuilding crowd, but now the hormone is being touted for perimenopause, “looks maxxing,” and more
What Can We Actually Find on an Exoplanet? Part 4: Looking For Us
Some signs of an alien civilization are easier to spot than signs of life itself. On technosignatures, from CFCs and industrial gases to the pandemic dip in pollution, and why Earth's most detectable moment might be right now.
Partial lunar eclipse Aug. 27-28 live updates: 3 days to go, here's what you need to know
The countdown is on for the deep partial lunar eclipse of Aug. 27-28. Over the next week, we'll be bringing you the latest eclipse news, viewing tips as well as live updates throughout eclipse night.
Although this isn't quite a total lunar eclipse, it's pretty close! At maximum eclipse, 96.2% of the moon will slip into Earth's dark central shadow known as the umbra, according to Time and Date. Much of the moon may take on a rusty red hue, while a thin sliver remains brightly illuminated.
It's the deepest partial lunar eclipse visible anywhere on Earth until Dec. 31, 2028, making it a must-see event worth staying up late — or setting an alarm early — for.
1 week to go until the deepest partial lunar eclipse until 2028The partial phase of a lunar eclipse captured over Sydney in September 2025. (Image credit: Photo by Saeed KHAN / AFP via Getty Images)We're officially one week away from one of the best skywatching events of the year!
On the evening of Aug. 27 (for North America), or the early hours of Aug. 28 (for western Europe), Earth's shadow will creep across the full moon during a very deep partial lunar eclipse. At maximum eclipse, 96.2% of the moon will be immersed in Earth's dark central shadow.
The eclipse will be visible, at least in some part, from North and South America, Europe, Africa and parts of western Asia, weather permitting. Observers in the Americas are well-positioned for the best views while skywatchers across Europe will need to look toward the western horizon before sunrise as the eclipse reaches its peak.
Read more: A 96% partial lunar eclipse is just 1 week away: Here's what you need to know.
August 21, 2026 – 6:05 AMWhy this partial lunar eclipse is one you won't want to missCraters and lunar seas mark the lunar surface during a deep lunar eclipse. (Image credit: Orchidpoet via Getty Images)When most people hear the words "partial lunar eclipse," they might often assume it will be less impressive than a total eclipse, and not really worth the effort to try and see it. But the Aug. 27-28 eclipse is anything but ordinary.
At maximum eclipse, 96.2% of the moon will be immersed in Earth's umbra, the darkest part of our planet's shadow. That means only a thin sliver of the lunar surface will remain directly illuminated by the sun, while the rest of the moon will take on a deep reddish-orange hue.
If you miss this one, you'll have to wait until Dec. 31, 2028 for another lunar eclipse that rivals it in spectacle. So whether you're planning on staying up late in the US or setting your alarms early in Europe, this is one skywatching show that's well worth making time for!
August 22, 2026 – 6:05 AMWhere will the Aug. 27-28 partial lunar eclipse be visible?The partial phase of a lunar eclipse captured over Canada in 2025. (Image credit: Photo by Chen Shaojin/VCG via Getty Images)The good news is that unlike a solar eclipse, a lunar eclipse can be seen from anywhere the moon is above the horizon. That means millions of skywatchers worldwide will have a chance to witness at least part of the Aug. 27-28 eclipse, weather permitting.
The best views will be from North and South America, where the entire eclipse will be visible. Across Europe and Africa, the eclipse takes place before dawn on Aug. 28, with the moon setting during the latter stages of the event.
Read more: Partial lunar eclipse August 2026: Where will it be visible from?
August 23, 2026 – 7:07 AMHow to view a partial lunar eclipseA lunar eclipse captured over the United Kingdom in 2007. (Image credit: Photo by Mike Hewitt/Getty Images)One of the wonderful things about a lunar eclipse is that it can be witnessed by everyone who happens to be on the night side of Earth as it occurs, weather permitting.
You don't need any special equipment like eclipse glasses to enjoy the show. Simply step outside and look up to see Earth's curved inner shadow crawl across the moon in a spectacular display of orbital mechanics.
Want a closer look? No problem! It's completely safe to point a pair of binoculars or a telescope at the moon during a lunar eclipse. Doing so will give you a magnified view of the colossal craters and dark lunar seas that mark the moon's near side as they fall within the umbral shadow.
August 24, 2026 – 3:35 AM3 days to go! Here's everything you need to know3 days until the partial lunar eclipse, here's everything you need to know. (Image credit: Eclipse inset: Giovanni Bortolani via Getty Images. Royalty Free. Graphic created in Canva Pro.)The deep partial lunar eclipse is just a few days away, so now is the perfect time to start planning how you're going to view the "almost blood moon".
At maximum eclipse, 96.2% of the moon's surface will be covered by Earth's dark central shadow known as the umbra. While the moon won't be completely eclipsed — so this isn't technically a "blood moon" — much of the lunar surface is expected to take on a reddish-orange hue, with just a thin sliver remaining brightly illuminated.
Check out our complete guide to the Aug. 27-28 partial lunar eclipse to make sure you're ready for the "almost blood moon".
A 96% partial lunar eclipse is just 1 week away: Here's what you need to know
We're just one week away from a stunning partial lunar eclipse on Aug. 27-28, when billions across North America, South America, Africa and Europe will see Earth's shadow dye the moon a subtle crimson hue, while leaving a thin crescent exposed to direct sunlight.
August's partial lunar eclipse will occur as Earth passes directly between the sun and moon during the full moon phase — an imperfect alignment that will see our planet's intense inner shadow cover 96% of the visible face of our natural satellite.
Stargazers on the night side of Earth will catch their first glimpse of our planet's umbra (the darkest, innermost part of its shadow) creeping onto the moon's surface at 10:33 p.m. EDT on Aug. 27 (0233 GMT on Aug. 28), according to TimeandDate.com. The vast shadow will continue its advance across the crater-scarred landscape in the hours that follow, until it hits the point of maximum eclipse at 12:12 a.m. EDT on Aug. 28 (0412 GMT).
Around this time, you may notice the shadowed region of the moon take on a reddish-orange color, as sunlight filtered through Earth's atmosphere is bent onto the lunar surface — a phenomenon often referred to as a "Blood Moon" during a total eclipse.
Each phase of a lunar eclipse occurs simultaneously for everyone viewing from the night side of Earth, where the lunar disk is visible. However, local timings will differ significantly depending on your location on Earth.
A partial lunar eclipse captured in the skies over the capitol city of Manila in the Philippines. (Image credit: Photo by Ted ALJIBE / AFP via Getty Images)If you're watching from a city on the West Coast of the United States like California, then the point of maximum eclipse will occur shortly after midnight local time on the night of Aug. 27-28.
Viewers in the United Kingdom, meanwhile, won't observe the moment of maximum eclipse until shortly before sunrise on Aug. 28, as the moon lurks low on the southwestern horizon. Be sure to check out a trusted website like TimeandDate for eclipse timings specific to your location.
You won't need any special kit to protect your eyes during a lunar eclipse as you would during a solar eclipse, when there is a serious risk of vision damage from looking directly upon the sun. However, a pair of quality binoculars or a telescope will give you a stunning view of Earth's shadow as it races across the lunar disk.
Need to upgrade your equipment? Then be sure to read our roundups of the best binoculars and telescopes available in 2026. You should also check out our guide to photographing a lunar eclipse, along with our picks of the top cameras and lenses for astrophotography.
Editor's Note: If you capture a photo of the lunar eclipse and want to share it with Space.com's readers, then please send your photo(s), comments, name and location to spacephotos@space.com.
ESA’s photosynthesis satellite fuelled
Europe’s newest eye on the health of Earth’s vegetation has taken another crucial step towards orbit – the European Space Agency’s FLEX satellite has been fuelled at Europe’s Spaceport in French Guiana ahead of its planned launch on 15 September at 03:21 CEST (14 September at 22:21 local time).
Rocket Lab launches private Japanese Earth-observing satellite to orbit (video)
Rocket Lab launched a private Japanese satellite to orbit this morning (Aug. 20), adding to a growing constellation of Earth-observing spacecraft.
An Electron vehicle lifted off from Rocket Lab's New Zealand site at 9:04 a.m. EDT (1304 GMT; 1:04 a.m. on Aug. 21 local New Zealand time), carrying aloft a radar satellite for the Tokyo-based company iQPS.
The nine 3D-printed Rutherford engines that power Electron's first stage shut off as planned about 2.5 minutes after liftoff. Separation with the rocket's second stage immediately followed, which burned for another 6.5 minutes before releasing Electron's "kick stage" with the IQPS payload for a 40-minute coast phase.
Electron lifts off from Rocket Lab's New Zealand launch site at 9:04 a.m. EDT (1304 GMT) on Aug. 20. (Image credit: Rocket Lab)This was Rocket Lab's ninth launch for iQPS, which is building a constellation of 36 synthetic aperture radar (SAR) satellites in low Earth orbit (LEO). Such spacecraft can study Earth day or night, and they can peer through cloud cover as well.
The iQPS network "is being developed and deployed at a rapid pace to provide high resolution and near-real time SAR imagery to its global users," Rocket Lab wrote in a description of today's mission, which it calls "The Lightning God Defends."
That name is a reference to the satellite going up today: It's nicknamed SUSANOO-II, after a Japanese lightning god.
Following the 40-minute coast phase of Electron's kick stage, the rocket completed one final burn to circularize its orbit and successfully deployed SUSANOO-II about 50 minutes after launch, at an altitude of 357 miles (575 kilometers).
Today's flight was Rocket Lab's 14th of 2026 and 93rd overall. The company's most recent launch, on Aug. 6, also lofted an iQPS satellite to LEO.
The vast majority of the company's flights have been performed by Electron, a 59-foot-tall (18 meters) rocket that gives small satellites dedicated rides to Earth orbit and beyond. Rocket Lab also operates a suborbital variant of Electron called HASTE, which allows customers to test sensors and other tech in the hypersonic flight environment.
APOD: 2026 August 20 – The Elephant’s Trunk in Cepheus
APOD
Astronomy Picture of the Day
Discover the cosmos! Each day a different image or photograph of our fascinating universe is featured, along with a brief explanation written by a professional astronomer.
The Elephant’s Trunk in Cepheus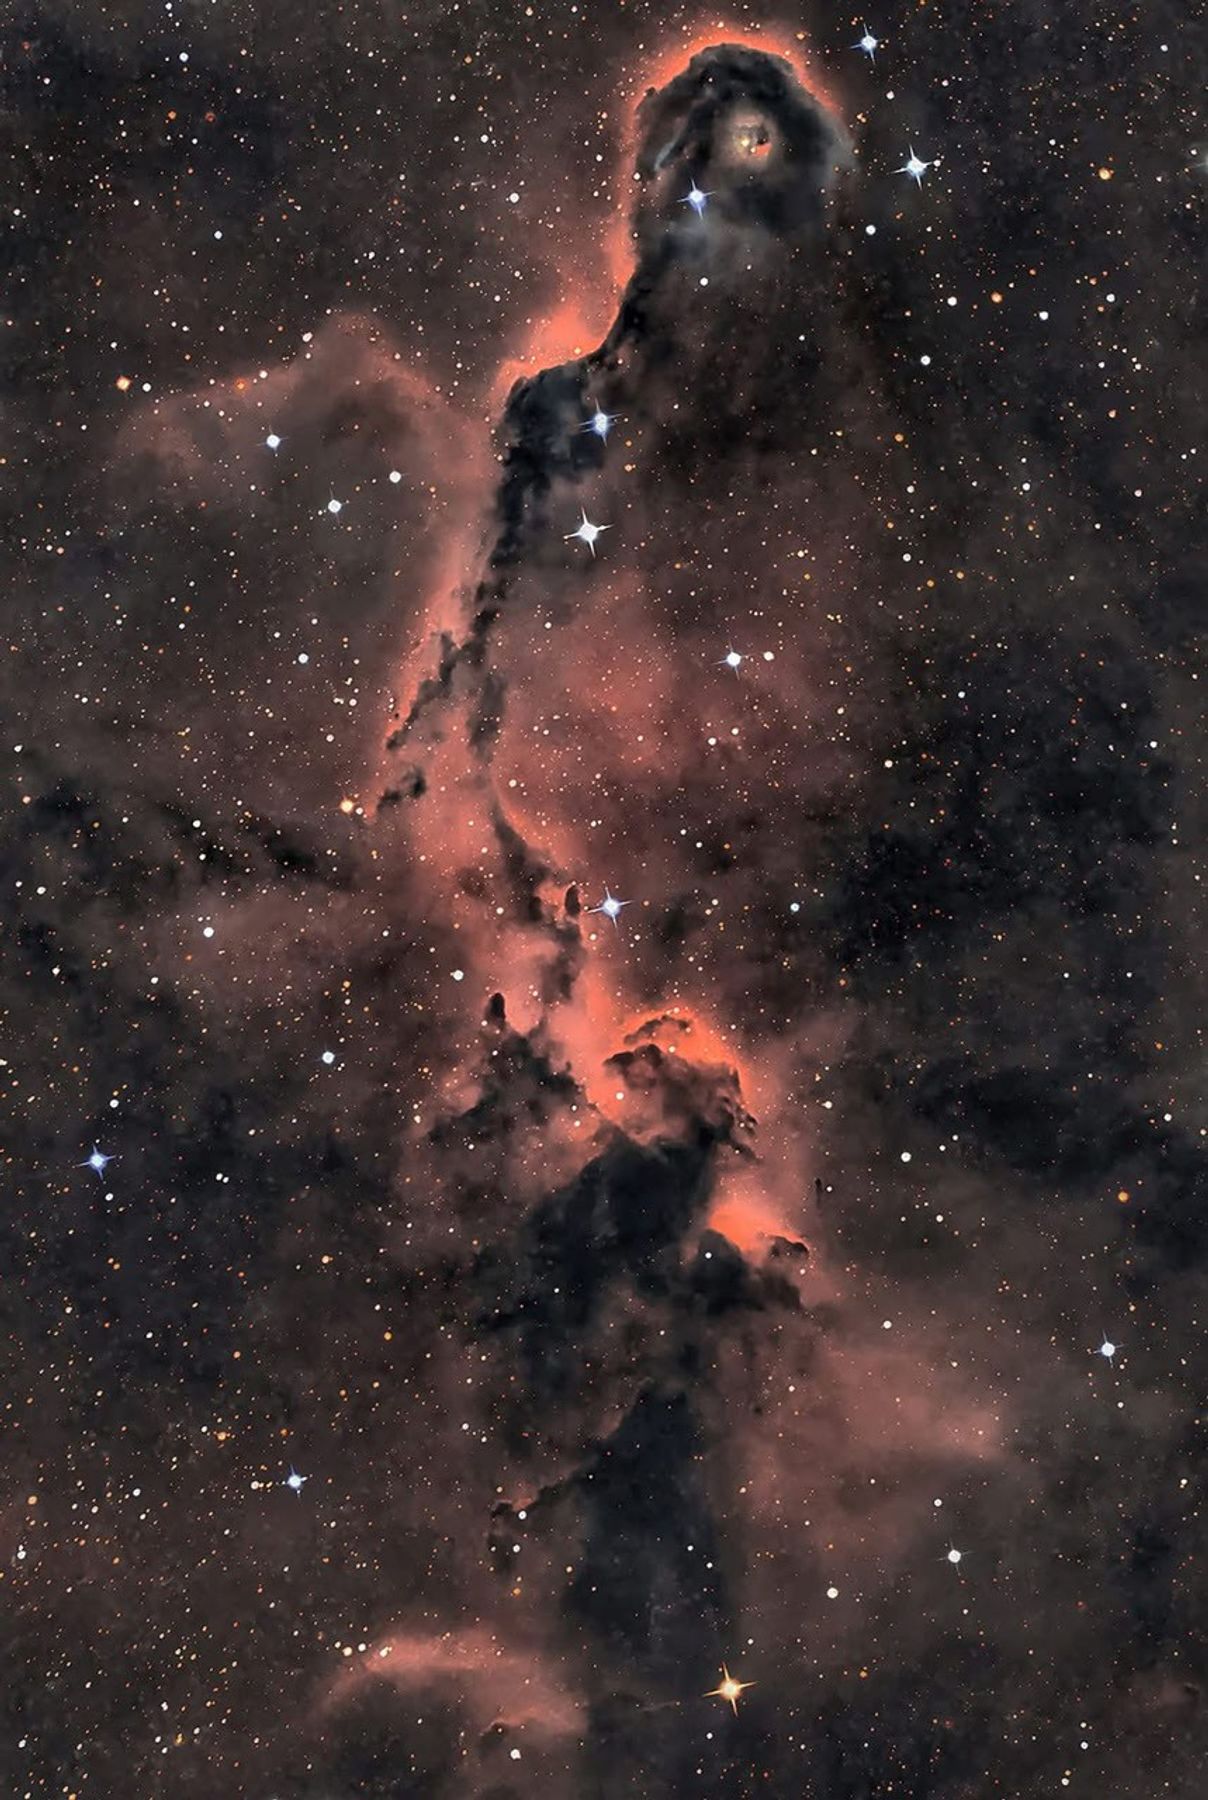
Explanation: Like an illustration in a galactic Just So Story, the Elephant’s Trunk Nebula winds through the emission region and young star cluster complex IC 1396, in the high and far off constellation of Cepheus. Also known as vdB 142, this cosmic elephant’s trunk is over 20 light-years long. The detailed telescopic view features the bright swept-back ridges and pockets of cool interstellar dust and gas that abound in the region. But the dark, tendril-shaped clouds contain the raw material for star formation and hide protostars within. Nearly 3,000 light-years distant, the relatively faint IC 1396 complex covers a large region on the sky, spanning over 5 degrees. Top to bottom this proboscidean-like rendition reaches across an almost 1 degree wide field of view, though. That’s a little less than the angular size of 2 full moons.
Tomorrow’s picture: pixels in spacetime
NASA Science Activation & Michigan Tech. U. Random APOD Generator Yesterday’s Image APOD: 2026 August 19 – The Case of the Mysterious Maybe Meteor Tomorrow’s Image
APOD: 2026 August 20 – The Elephant’s Trunk in Cepheus
APOD
Astronomy Picture of the Day
Discover the cosmos! Each day a different image or photograph of our fascinating universe is featured, along with a brief explanation written by a professional astronomer.
The Elephant’s Trunk in Cepheus
Explanation: Like an illustration in a galactic Just So Story, the Elephant’s Trunk Nebula winds through the emission region and young star cluster complex IC 1396, in the high and far off constellation of Cepheus. Also known as vdB 142, this cosmic elephant’s trunk is over 20 light-years long. The detailed telescopic view features the bright swept-back ridges and pockets of cool interstellar dust and gas that abound in the region. But the dark, tendril-shaped clouds contain the raw material for star formation and hide protostars within. Nearly 3,000 light-years distant, the relatively faint IC 1396 complex covers a large region on the sky, spanning over 5 degrees. Top to bottom this proboscidean-like rendition reaches across an almost 1 degree wide field of view, though. That’s a little less than the angular size of 2 full moons.
Tomorrow’s picture: pixels in spacetime
NASA Science Activation & Michigan Tech. U. Random APOD Generator Yesterday’s Image APOD: 2026 August 19 – The Case of the Mysterious Maybe Meteor Tomorrow’s Image
An Uncommon Drifter in the Denmark Strait
- Earth
- Earth Observatory
- Image of the Day
- EO Explorer
- Topics
- More Content
- About
An Uncommon Drifter in the Denmark Strait
- Earth
- Earth Observatory
- Image of the Day
- EO Explorer
- Topics
- More Content
- About